jinki
Level 3 Rank

Posts: 123
|
Post by jinki on Jul 3, 2010 7:02:51 GMT
"Whenever you introduce a threshold, you introduce bias. The sun does that itself by not showing us all the spots and specks below 1500G. The L&P effect is precisely about that bias introduced by the Sun, which makes the SSN useless as solar activity indicator. Your additional bias just makes that worse [which is, of course, why you do it, to make SC24 look like SC5 or worse]"The top values are increasing as SC24 takes hold, it will take the top values to drop under 1500 gauss for the L&P prediction to come to fruition (what was the title of the paper again?). Nothing else needs to be taken into consideration. The 23 pixel limit in regard to comparing SC24 to SC5 is to align the method with Wolf's reconstruction as you well know. Your own research agrees with this, unless you would like to remove it from the record now? 1: the values for SC5 are very uncertain [lack of data] by a factor of two. 2: All Wolf's [and Wolfer's and Brunner's] numbers should be increased by 20% anyway. The top values are not important as I just showed, as the sunspot number is determined by the smaller spots. For one big one in a group there can be up to a hundred small ones in the same group. A reasonable interpretation of L&P would be [just like during the Maunder Minimum] that very big spots would still be seen, but all the small ones are gone. Your threshold [as any threshold] introduces bias. Of course, some people want bias, so it is understandable why you do it. I think we both agree the sunspot record needs to be adjusted. Adjust the earlier records or reduce the later, it doesn't matter. But I am surprised at your reluctance to accept another counting standard that supports your views and also that you would support an "effect" with such bad data. Your prediction for SC24 may have something to do with it, but I for one am enjoying watching how it all transpires. |
|
|
|
Post by lsvalgaard on Jul 3, 2010 7:19:07 GMT
1: the values for SC5 are very uncertain [lack of data] by a factor of two. 2: All Wolf's [and Wolfer's and Brunner's] numbers should be increased by 20% anyway. The top values are not important as I just showed, as the sunspot number is determined by the smaller spots. For one big one in a group there can be up to a hundred small ones in the same group. A reasonable interpretation of L&P would be [just like during the Maunder Minimum] that very big spots would still be seen, but all the small ones are gone. Your threshold [as any threshold] introduces bias. Of course, some people want bias, so it is understandable why you do it. I think we both agree the sunspot record needs to be adjusted. Adjust the earlier records or reduce the later, it doesn't matter. But I am surprised at your reluctance to accept another counting standard that supports your views and also that you would support an "effect" with such bad data. Your prediction for SC24 may have something to do with it, but I for one am enjoying watching how it all transpires. For practical reasons one must adjust the earlier [some operational systems use the recent sunspot numbers]. I think Wolf's method is flawed and that Wolfer [and all later observers] is correct in counting EVERYTHING they can see. If you emulate Wolf, then your method is equally flawed. Since the real prediction of SC24 is to be expressed in F10.7 flux [~120], the prediction will not be victim to any L&P effect. See slide 37 of www.leif.org/research/Predicting%20the%20Solar%20Cycle%20(SORCE%202010).pdf therefore my prediction of SC24 has nothing to do with it. The L&P effect is a working hypothesis that explains three things: 1) the L&P data themselves 2) the divergence between F10.7 and SSN 3) the absence of visible spots during the Maunder and Spoerer minima, where the cosmic ray modulation was similar to modern values. This is impressive and commands attention. Whether the hypothesis will be supported by future data remains to be seen. |
|
jinki
Level 3 Rank
Posts: 123
|
Post by jinki on Jul 3, 2010 9:31:58 GMT
I think Wolf's method is flawed and that Wolfer [and all later observers] is correct in counting EVERYTHING they can see. If you emulate Wolf, then your method is equally flawed.Cant argue with that, Wolf most likely modeled his sunspot formula on trying to agree with the geomagnetic record, which has unfortunately left us with a very average way of counting spots. But the only reason for emulating Wolf is to get a direct scientific comparison, I thought you would understand that? The L&P effect is a working hypothesis that explains three things:
1) the L&P data themselvesThe data is poor as shown here www.landscheidt.info/?q=node/652) the divergence between F10.7 and SSNThere is no divergence other than the one you have created see here www.landscheidt.info/?q=node/653) the absence of visible spots during the Maunder and Spoerer minima, where the cosmic ray modulation was similar to modern values.Once again perhaps in your universe, Solanki and Steinhilber who know the record disagree with you. 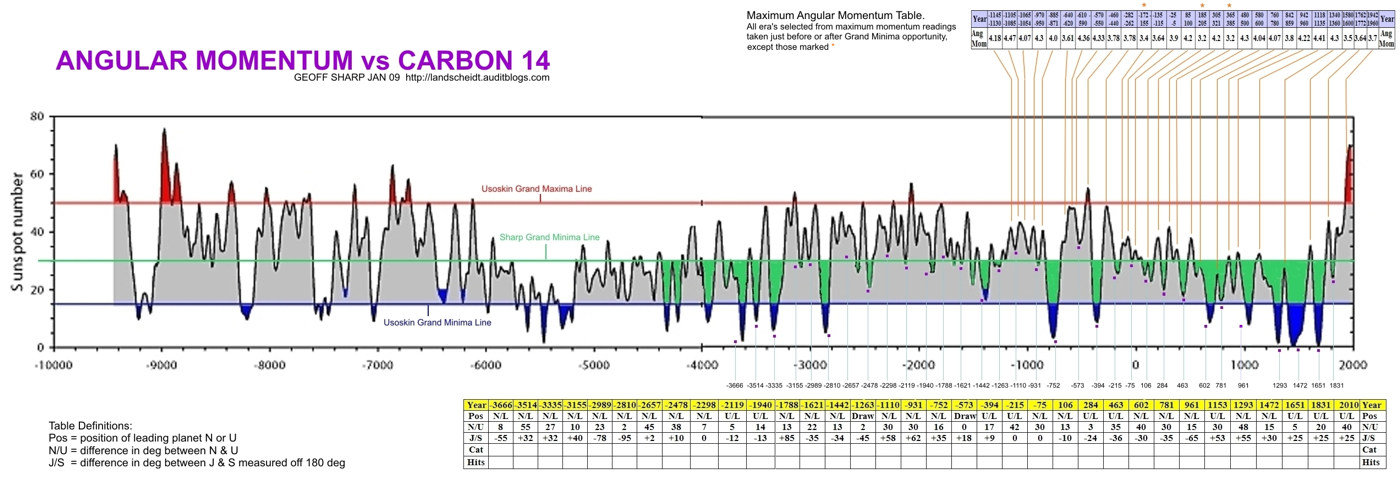
|
|
|
|
Post by lsvalgaard on Jul 3, 2010 12:56:34 GMT
I think Wolf's method is flawed and that Wolfer [and all later observers] is correct in counting EVERYTHING they can see. If you emulate Wolf, then your method is equally flawed.Cant argue with that, Wolf most likely modeled his sunspot formula on trying to agree with the geomagnetic record, which has unfortunately left us with a very average way of counting spots. But the only reason for emulating Wolf is to get a direct scientific comparison, I thought you would understand that? 3) the absence of visible spots during the Maunder and Spoerer minima, where the cosmic ray modulation was similar to modern values.Once again perhaps in your universe, Solanki and Steinhilber who know the record disagree with you. Wolf did not observe during SC5. And he devised his formula before discovering that geomagnetic activity could be used to calibrate the data. cosmic rays: www.leif.org/EOS/2009GL038004.pdf"A comparison with sunspot and neutron records confirms that ice core 10Be reflects solar Schwabe cycle variations, and continued 10Be variability suggests cyclic solar activity throughout the Maunder and Spoerer grand solar activity minima." adsabs.harvard.edu/abs/2007AdSpR..40.1060M"The time series of radiocarbon content obtained from Japanese cedar is now available 1413 AD through 1745 AD. Frequency analyses of the radiocarbon data for the Spoerer and the Maunder minima show that the Sun continues periodic variations even during periods of long-lasting sunspot absence" Solanki and Steinhilber may know the record, but clearly you do not. |
|
jinki
Level 3 Rank
Posts: 123
|
Post by jinki on Jul 3, 2010 14:49:18 GMT
I think Wolf's method is flawed and that Wolfer [and all later observers] is correct in counting EVERYTHING they can see. If you emulate Wolf, then your method is equally flawed.Cant argue with that, Wolf most likely modeled his sunspot formula on trying to agree with the geomagnetic record, which has unfortunately left us with a very average way of counting spots. But the only reason for emulating Wolf is to get a direct scientific comparison, I thought you would understand that? 3) the absence of visible spots during the Maunder and Spoerer minima, where the cosmic ray modulation was similar to modern values.Once again perhaps in your universe, Solanki and Steinhilber who know the record disagree with you. Wolf did not observe during SC5. And he devised his formula before discovering that geomagnetic activity could be used to calibrate the data. cosmic rays: www.leif.org/EOS/2009GL038004.pdf"A comparison with sunspot and neutron records confirms that ice core 10Be reflects solar Schwabe cycle variations, and continued 10Be variability suggests cyclic solar activity throughout the Maunder and Spoerer grand solar activity minima." adsabs.harvard.edu/abs/2007AdSpR..40.1060M"The time series of radiocarbon content obtained from Japanese cedar is now available 1413 AD through 1745 AD. Frequency analyses of the radiocarbon data for the Spoerer and the Maunder minima show that the Sun continues periodic variations even during periods of long-lasting sunspot absence" Solanki and Steinhilber may know the record, but clearly you do not. We all know he was just a baby during the Dalton, but his reconstruction is what is important. What evidence do you have that his formula was devised before his knowledge of the geomagnetic data? Your other references show a modulation of the solar wind during grand minima, of course this will happen just as the gauss reading will follow the same curve. What is important is the degree of the modulation which you fail to recognize. Isotope records from both sources show monumental differences in cosmic ray values when compared with recent history, your attempt to compare the two is ludicrous. You will need to do better. |
|
|
|
Post by lsvalgaard on Jul 3, 2010 15:27:59 GMT
Wolf did not observe during SC5. And he devised his formula before discovering that geomagnetic activity could be used to calibrate the data. cosmic rays: www.leif.org/EOS/2009GL038004.pdf"A comparison with sunspot and neutron records confirms that ice core 10Be reflects solar Schwabe cycle variations, and continued 10Be variability suggests cyclic solar activity throughout the Maunder and Spoerer grand solar activity minima." adsabs.harvard.edu/abs/2007AdSpR..40.1060M"The time series of radiocarbon content obtained from Japanese cedar is now available 1413 AD through 1745 AD. Frequency analyses of the radiocarbon data for the Spoerer and the Maunder minima show that the Sun continues periodic variations even during periods of long-lasting sunspot absence" Solanki and Steinhilber may know the record, but clearly you do not. We all know he was just a baby during the Dalton, but his reconstruction is what is important. What evidence do you have that his formula was devised before his knowledge of the geomagnetic data? Your other references show a modulation of the solar wind during grand minima, of course this will happen just as the gauss reading will follow the same curve. What is important is the degree of the modulation which you fail to recognize. Isotope records from both sources show monumental differences in cosmic ray values when compared with recent history, your attempt to compare the two is ludicrous. You will need to do better. I have read all of Wolf's papers on this. Slide 5 of www.leif.org/research/Rudolf%20Wolf%20Was%20Right.pdf shows the evolution of the Wolf Number over time: 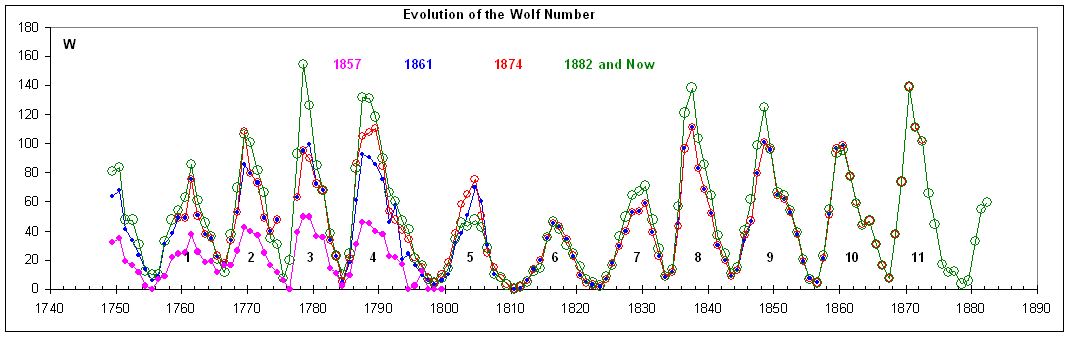 The pink curve shows the numbers [from his 1857 list] before he discovered the geomagnetic calibration. The blue curve [from his 1861 list] shows the numbers after his discovery. And finally the green curve showing his 1882 list [the present SIDC numbers almost match the 1882 list]. Note, how he treated the very uncertain and sparse data for SC5. This can also be seen here:  The data for SC5 are so poor [note how he fiddled the point to lower values] that any detailed comparison is meaningless [but hey, people make meaningless comparisons all the time, so you are in 'good' company] The papers cited show that the degree of modulation was not any smaller. E.g. from Berggren's paper:  Maunder Minimum is in the circle, where the red [Sun] curve flatlined. The large differences in the background level are not due to the Sun, but to climatic and local snowfall variations. E.g. from arxiv.org/ftp/arxiv/papers/1003/1003.4989.pdf : "These inconsistencies all suggest that "atmospheric" or "local" effects, which may be at least as large as or larger than changes in the input production function, are apparently able to modify the ratio of production to concentration of 10Be. This result compliments recent climatic studies e.g., Field, Schmidt and Shindall, 2009, and references therein, which suggest climatic effects will produce significant modifications to the production to concentration ratio of 10Be." |
|
jinki
Level 3 Rank
Posts: 123
|
Post by jinki on Jul 4, 2010 2:48:49 GMT
The pink curve shows the numbers [from his 1857 list] before he discovered the geomagnetic calibration. The blue curve [from his 1861 list] shows the numbers after his discovery. And finally the green curve showing his 1882 list [the present SIDC numbers almost match the 1882 list].
This is an interesting area, did Wolf get lucky with his formula so that it today closely follows flux or was it designed with that in mind? If the pink curve is an early reconstruction using his formula it would suggest he got lucky?
The isotope records obviously show a modulation during past minima but you cannot attempting to state the levels are the same as the last few cycles. The 14C & 10Be records are in stark contrast to your solar floor theory.
|
|
|
|
Post by lsvalgaard on Jul 4, 2010 3:34:57 GMT
"The pink curve shows the numbers [from his 1857 list] before he discovered the geomagnetic calibration. The blue curve [from his 1861 list] shows the numbers after his discovery. And finally the green curve showing his 1882 list [the present SIDC numbers almost match the 1882 list]." This is an interesting area, did Wolf get lucky with his formula so that it today closely follows flux or was it designed with that in mind? If the pink curve is an early reconstruction using his formula it would suggest he got lucky? Wolf wanted to measure area, but discovered that that would be no good for the observations already made, so he had to settle for next best. He noted that on average, a group has ten spots, so 10*G+S would give about equal weight to Groups and Spots and be a rough measurement of area as well, because when you have a group it tends to have a certain size [and bigger if S was bigger]. When he discovered the geomagnetic connection he assumed [very reasonably] that more sunspots would result in more of whatever controlled the response [UV we now know]. By comparing the Wolf number with the geomagnetic response a linear relation became evident and he realized that that relation could be an objective measure of the 'agent' [solar activity] that controlled the amplitude of the diurnal variation and hence could be the bridge to the older data that would allow him to put them all on the same scale. This was not luck, but solid science within the framework of knowledge of the day. He was stumped for some time because of the paucity of data [but solar and geomagnetic] for SC5, so changed his mind at times. He finally came upon some auroral data and [also knowing that those responded to solar activity] and used those for calibration. But it should be clear that the result is very uncertain. |
|
jinki
Level 3 Rank
Posts: 123
|
Post by jinki on Jul 4, 2010 3:53:41 GMT
This was not luck, but solid science within the framework of knowledge of the day.But was he lucky that his formula happened to replicate the flux values seeing he was unaware of the geomagnetic measurements. His formula turns a single spot into 11 that has the effect of filling in the flux value as the single spot area quite likely has a reasonable plage area surrounding it (this is further enhanced when Wolfer began counting specks). If he had used area alone this match up would not have been nearly as good. 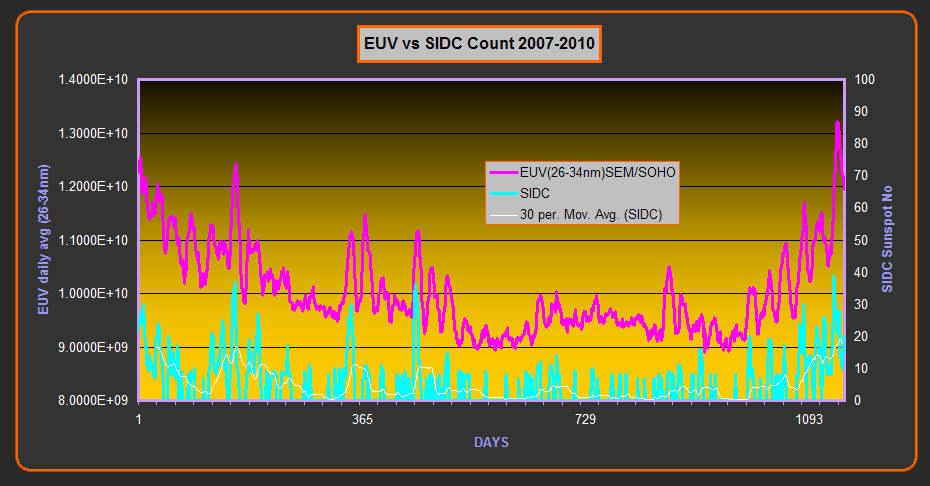 The downslope of SC23 showing the mismatch at times between SSN and UV
|
|
|
|
Post by lsvalgaard on Jul 4, 2010 4:58:14 GMT
This was not luck, but solid science within the framework of knowledge of the day.But was he lucky that his formula happened to replicate the flux values seeing he was unaware of the geomagnetic measurements. His formula turns a single spot into 11 that has the effect of filling in the flux value as the single spot area quite likely has a reasonable plage area surrounding it (this is further enhanced when Wolfer began counting specks). If he had used area alone this match up would not have been nearly as good. The downslope of SC23 showing the mismatch at times between SSN and UV Wolf was well aware of plages or faculae and took what emissions that might arise from a group [active region] into account by giving a group 10 times the weight of a spot. BTW, be careful with terminology. Unqualified 'flux' is almost always the F10.7 microwave flux. Wolf knew that the sunspot number not was the whole story, because the amplitude of the diurnal variation does not fall to zero even a solar minimum, but retains about a third of its solar maximum value. So, the Sun is emitting something [besides ordinary light and heat] even when there is no visible activity. |
|
|
|
Post by lsvalgaard on Jul 4, 2010 5:04:24 GMT
The isotope records obviously show a modulation during past minima but you cannot attempting to state the levels are the same as the last few cycles. The 14C & 10Be records are in stark contrast to your solar floor theory. The modulation was even larger back then [the circle]: As the heliomagnetic field [HMF B] is thought to control the cosmic ray modulation, the finding that the cosmic ray modulation was not smaller during the Maunder Minimum suggests starkly that HMF B was not smaller either but behaving not much different than in recent cycles including the modern floor. |
|
|
|
Post by lsvalgaard on Jul 7, 2010 16:25:24 GMT
Update on L&P:  includes several measurements of 1084, at the upper envelop where we would expect it to be with the other large spots up there through SC23. |
|
AD6AA
Level 2 Rank
Posts: 82
|
Post by AD6AA on Jul 7, 2010 18:23:21 GMT
Thanks for the update.
The second chart with the Gauss starting at 1000 was very interesting to me. Am I correct in thinking that once the spot disappears, (Visually) there is no more measurement of the Gauss. If so, then the graph line should be getting flatter as the spots disappear, since we are limited to 1500 Gauss at the bottom, but unlimited at the top.
Mike
AD6AA
|
|
|
|
Post by lsvalgaard on Jul 7, 2010 19:20:48 GMT
Thanks for the update. The second chart with the Gauss starting at 1000 was very interesting to me. Am I correct in thinking that once the spot disappears, (Visually) there is no more measurement of the Gauss. If so, then the graph line should be getting flatter as the spots disappear, since we are limited to 1500 Gauss at the bottom, but unlimited at the top. AD6AA Not quite, as there simply weren't any near the bottom at 1500 G earlier on. But from now on, the spread might get smaller, although there will still be the occasional large spots [as there were during the Maunder Minimum]. |
|
jinki
Level 3 Rank
Posts: 123
|
Post by jinki on Jul 8, 2010 1:02:11 GMT
includes several measurements of 1084, at the upper envelop where we would expect it to be with the other large spots up there through SC23.
Thanks for the update, 1084 looking to post some big values. Is there any chance of seeing the data, it will be useful to see how the 1084 guass readings compare with the darkness ratio.
|
|

