|
|
Puzzle
Mar 15, 2010 18:38:16 GMT
Post by nautonnier on Mar 15, 2010 18:38:16 GMT
All you're really saying here is that air temperatures can be highly variable. We know that. However air (and sea surface) temperatures do ultimately reflect the amount of heat in the system - if a little "noisily". This is why we don't rely on a small sample of measurements. The measurerments cover all conditions and hence the average is robust. Short-term climate events can't corrupt the overall trend. The recent very warm readings in the troposphere have barely changed the long term trend. They might, though, affect the shorter term trend (e.g. 5 to 10 years) a little more. This is the main reason why trends of less than around 20 years in length can be misleading. Short-term, e.g. ENSO events, have a greater influence. Your argument holds up if we took all the measurements taken to-day with the intention of calculating a global temperature. Firstly we would have no idea if to-day was 'typical' or 'normal'. Secondly, and perhaps more importantly, no-one claims to be calculating a global temperature. We're not actually trying to determine a global temperature. We are trying to determine the temperature increase (or decrease) over a period of time. To use an analogy. It's like trying to find whether the water level in a lake has risen (or fallen). We don't need to know the depth of the lake. We just need to know the start level. If we have a large enough sample of measurements for each month/year then we can detemine the change in the level of the lake to a reasonable degree of accuracy. There are sound statistical reasons for believing that the trends for all the datasets are, given the confidence intervals specified, reliable and robust. A second analogy (or illustration). If I want to find the average height of US adult males what do I do? I can select a random sample take the average and then provide a confidence interval. How large should the sample be? 2? I can calculate an average but how reliable is it. If my random sample just happens to have picked a couple of basketball players then it's not much use. 10? A bit better but the average is still likely to be heavily influenced by a couple of Danny DeVitos or a couple of Arnies in the sample. 100? We could be starting to home in on the true mean. But we'd probably have a relatively wide CI. 1000? This should provide a decent estimate. But we can't rule out the fact that there is some bias in the data. However the variability of the data can be calculated and this should lead to relatively 'tight' CI. To summarise: All your concerns are recognised. However by using appropriate sampling, both in size and spatial coverage, the influence of short term events is minimised. No I am not saying that - I am saying that temperature is NOT a guaranteed way of measuring heat content - and when some 'weather' patterns occur - and for the last few MONTHS the polar vortex has been displaced considerably far south bringing drier air - an apparent rise in _global_average_ temperatures can occur although for those on the ground in the temperate latitudes it was noticeably colder as heat content has not changed and may even have dropped. This is because the heat _distribution_ was different and less heat is needed for dry air. Temperature does not measure heat content. "A second analogy (or illustration). If I want to find the average height of US adult males what do I do? I can select a random sample take the average and then provide a confidence interval. How large should the sample be?"i know you want to slide away into the safety of maths..... but this is a conceptual problem.... To use your analogy you are trying to find the average height of a US male by measuring their weight. normally this is a reasonable correlation but not always. Temperature is NOT heat content. |
|
|
|
Puzzle
Mar 16, 2010 3:51:14 GMT
Post by magellan on Mar 16, 2010 3:51:14 GMT
When warmers explain this dilemma, they'll have my ear. Until then, all the arm waiving about radiative "forcing"/climate sensitivity/Arrhenius blah blah blah is vanity. Its not difficult to figure out something is wrong with the AGW hypothesis speculation after 7 years of failed model predictions for total heat accumulation in the climate system. Sorry glc and socold, the ad hoc 30 year requirement does not apply to this metric. Hansen said OHC does not need 30 years of data for proof of concept. Please no more talk about "blips on the radar". We've been lectured for the last ten years that AGW has overcome natural variation, whatever that means, and 2005 was the year of definitive proof supporting the CO2 AGW hypothesis speculation. It is in no uncertain terms; CO2 WILL absorb IR, causing cloud cover to accommodate the required massive positive feedback Super Hero water vapor, warm the oceans, release more water vapor, more CO2 and on and on. Its never happened, but makes fo good talk at the bar. Please no more hype from either side about deep cooling moments or spikes upward. They mean nothing. No more splitting hairs arguing over .05C here or .1C there. Its not necessary other than to note 1998 is not being surpassed now 12 years later based on the untenable "global surface temperature". When temperatures begin their decline in the coming months, that's to be expected. El Nino will be but a memory in 12 months then your grandchildren in another 12 years can be told the story about the 2010 El Nino was almost as strong as other ENSO events. The facts are what they are, and there are reasons for it. Please no more claims of, "heat in the pipeline", hiding somewhere in the oceans deep waiting to unleash her fury in 30 years. It's bunk. There is no "missing heat". It's gone ok and the brainwashed skulls full of mush won't really care to notice Al Gore praying for a miracle from Gaea. The first two following graphs break it down to the simplest form of argument. Nothing more is necessary. After an apparent faulty analysis in 2006 by Lyman/Willis, it has since had at least 3 reanalyses performed, all of which resulted from flat to cooling. The latest NODC (Levitus) rendition confirms Willis and Loehle. In no uncertain terms no matter which is used, it falsifies the Hansen et al (includes Willis and Schmidt) 2005 "smoking gun" whose proclamation was based on data from 1993-2003, which many are questioning its validity alone because of the odd step change from 2002-2003. No ifs, ands or buts, it is failed. 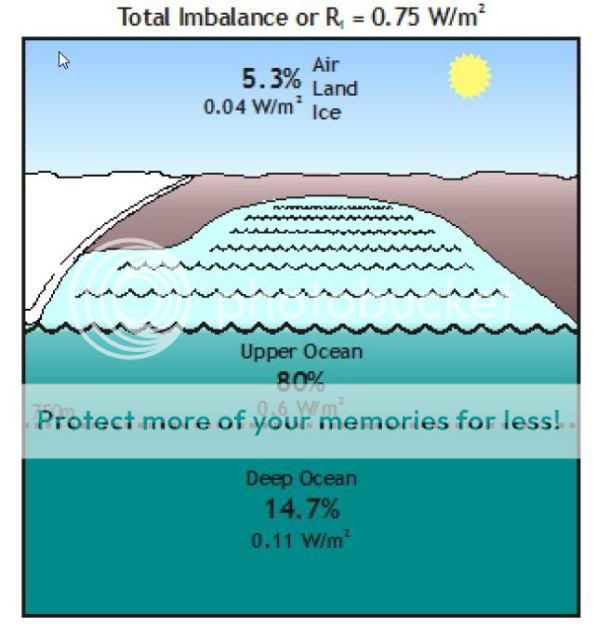  Maybe the best way to summarize the situation is the chart below. At least Trenberth had guts in the Climategate emails, to admit it.  So my challenge polite request, which has thus far fallen on deaf ears by every warmer in this forum, is for someone to explain the loss of heat in the climate system vis-a-vis OHC. I'm not interested in more hyperbole, just numbers. Roll out the numbers to account for the "missing heat" that was guaranteed to rise infinium. If the lack of warming does not disprove the most recent CO2 AGW axiom, fine, then give the details why. I know what the calculations are for these issues and won't bore readers with them. Do yourselves a favor and dig into the varioius SST/OHC indices, get your ducks in a row and have at it. edited to repair the King's English that was mercilessly tortured. |
|
|
|
Puzzle
Mar 16, 2010 4:06:52 GMT
Post by poitsplace on Mar 16, 2010 4:06:52 GMT
The biggest "puzzle" is why any of these climatologists (or whatever type of science they specialize in) continue to believe that they have substantial knowledge about how the climate system functions. Seriously, at this point its like watching a cat chase a laser pointer. They keep jumping on different metrics as the old predictions fail. Everything they thought was caused by warming is going in entirely the wrong direction. The temperature stopped rising so they went with ocean heat content...oops, ocean heat content is falling. Sea levels are rising faster and fast...oops, they're not rising fast at all now. Wait, the jet streams move toward the poles because of global...oops, they plunged into the south again. El Nino's are caused by warming...oops, no help there. Sea ice is decreasing faster than...oops. Himalayan glaciers? Antarctic/Greenland ice sheets shrin...oops, nope.
When this sort of thing happens to a REAL scientist...they scrap their hypothesis and go back to the drawing board. I'm not seeing many of the climatologists doing this.
|
|
|
|
Puzzle
Mar 16, 2010 5:55:21 GMT
Post by scpg02 on Mar 16, 2010 5:55:21 GMT
The biggest "puzzle" is why any of these climatologists (or whatever type of science they specialize in) continue to believe that they have substantial knowledge about how the climate system functions. Uh, constant positive feedback? |
|
|
|
Puzzle
Mar 16, 2010 12:35:56 GMT
Post by steve on Mar 16, 2010 12:35:56 GMT
Magellan, you're mixing your metrics. The ocean heat content went up by a large amount after 1998, and the change since 2004 is minuscule compared with this increase. The "challenge" hasn't fallen on deaf ears. The replies appear to have though. There is no statistically significant loss of heat from the ocean. I have not seen a model diagnostic for ocean heat content, but a stable atmospheric temperature even for 10 years is in line with the performance of many models which show similar stable periods *despite* being forced by increasing CO2 and not including any other unknown forcings that might be influencing the real earth. What was that about wanting no hyperbole  You seem to have completely missed the meaning of the "in the pipeline" metaphor. There *is* no heat hiding in the ocean, and, since you mention Hansen, there is nothing in Hansen's paper that says there is heat hiding in the ocean. The closest the paper comes is to saying that there is 'warming "in the pipeline"' which is a subtle but important difference. You can't impress us "warmers" by trying to win the argument by misrepresenting or deliberately misunderstanding the views of the people that you disagree with. |
|
|
|
Puzzle
Mar 16, 2010 13:03:34 GMT
Post by magellan on Mar 16, 2010 13:03:34 GMT
Magellan, you're mixing your metrics. The ocean heat content went up by a large amount after 1998, and the change since 2004 is minuscule compared with this increase. The "challenge" hasn't fallen on deaf ears. The replies appear to have though. There is no statistically significant loss of heat from the ocean. I have not seen a model diagnostic for ocean heat content, but a stable atmospheric temperature even for 10 years is in line with the performance of many models which show similar stable periods *despite* being forced by increasing CO2 and not including any other unknown forcings that might be influencing the real earth. What was that about wanting no hyperbole You seem to have completely missed the meaning of the "in the pipeline" metaphor. There *is* no heat hiding in the ocean, and, since you mention Hansen, there is nothing in Hansen's paper that says there is heat hiding in the ocean. The closest the paper comes is to saying that there is 'warming "in the pipeline"' which is a subtle but important difference. You can't impress us "warmers" by trying to win the argument by misrepresenting or deliberately misunderstanding the views of the people that you disagree with. Stop diverting the issue again. You have answered nothing. The charts say it all. If you can't explain why the "smoking gun" is shooting blanks, at least have the courage to acknowledge the pie chart describing the true state of climate science. You can't impress us "warmers" by trying to win the argument by misrepresenting or deliberately misunderstanding the views of the people that you disagree with. I'm not interested in your views or whether if anyone is impressed. I'm interested in facts. Is it true OHC is not increasing per Hansen's model prediction? Yes or no? |
|
|
|
Puzzle
Mar 16, 2010 14:36:00 GMT
Post by steve on Mar 16, 2010 14:36:00 GMT
I can't see the images at the moment. I'll try and remember to comment more later.
Will you be beating your partner again tonight? Yes or no?
Hansen has not made a model prediction of monotonically increased heating. In this paper Hansen has not made a model prediction for OHC at all. Whatever your interpretation of Hansen's paper, monotonically increasing ocean heat content does not appear to be a position held by any ocean scientist I'm aware of.
You appear to be interpreting the pause or insignificant fall in OHC as an evidence that there is no committed warming. Trenberth has said that there is not enough observational data to determine all the inputs into the energy balance equation. I don't see any evidence that suggests that 6, or even 10 years, is long enough to tell. But there is evidence of previous "pauses", and this may be another. So we're back to saying that current observations do not sufficiently constrain sensitivity.
|
|
|
|
Puzzle
Mar 16, 2010 15:07:41 GMT
Post by icefisher on Mar 16, 2010 15:07:41 GMT
Magellan, you're mixing your metrics. The ocean heat content went up by a large amount after 1998, and the change since 2004 is minuscule compared with this increase. Monitoring was grossly inadequate in 1998-2003. That is especially true since the argument from the AGW alarmists now is that the 2004 plus monitoring is inadequate to capture the "missing heat". If that is true and it has to be true for AGW from CO2 to be an emergency issue. . . .we are just guessing that there was any unusual ocean warming post 1998 as opposed to an anomalous pooling of warm water at the surface. Bottomline here is the underlying .5degC per century warming. . . .the jury is out that there is anything more than that from any cause. Such rates of change appear to be normal fluctuations looking at ice core data. The "challenge" hasn't fallen on deaf ears. The replies appear to have though. There is no statistically significant loss of heat from the ocean. I have not seen a model diagnostic for ocean heat content, but a stable atmospheric temperature even for 10 years is in line with the performance of many models which show similar stable periods *despite* being forced by increasing CO2 and not including any other unknown forcings that might be influencing the real earth. Could you graph those stable periods for us Steve? Does it look any different than Easterbrook's or Akasofu's. I have been asking you for months to put a pen to paper outlining your belief system on a historic basis. Why are you afraid to do that when you acknowledge it so openly? What was that about wanting no hyperbole You seem to have completely missed the meaning of the "in the pipeline" metaphor. There *is* no heat hiding in the ocean, and, since you mention Hansen, there is nothing in Hansen's paper that says there is heat hiding in the ocean. The closest the paper comes is to saying that there is 'warming "in the pipeline"' which is a subtle but important difference. You can't impress us "warmers" by trying to win the argument by misrepresenting or deliberately misunderstanding the views of the people that you disagree with. LOL! The ultimate moving on argument. Just ignore where ever the heat generated by CO2 forcing to date has disappeared to just trust you that future warming will is coming. ROTFLMAO!!! You sound like Drew Peterson trying to entice a third wife. |
|
|
|
Puzzle
Mar 16, 2010 15:51:48 GMT
Post by steve on Mar 16, 2010 15:51:48 GMT
Icefisher Define "grossly inadequate". There has been a statistically significant rise over the 10 years prior to 2004 even taking into account the better coverage provided by the ARGO data. That rise was vastly larger than the statistically insignificant fall since 2004. To use your terminology, monitoring since 2004 has been too "grossly inadequate" to capture any change one way or another. And you still don't understand. There is no "missing heat" being purported. It is accepted that the OHC has not significantly changed. Akasofu's curve is a fictional version of the atmosphere surface temperature. The black line in the following seems to represent one of the latest analyses that demonstrate the variability in OHC.  I'm not "moving on". The argument is whether there is an underlying imbalance such that (roughly speaking) the "average" climate we ought to expect will result in resumed warming. It is not some silly idea that there is a mass of warm water has been secretly buried in the deep ocean. I think ideas like that are used by certain sceptics when attempting to defend unscientific hypotheses about long term cycles. |
|
|
|
Puzzle
Mar 16, 2010 16:22:54 GMT
Post by hunter on Mar 16, 2010 16:22:54 GMT
This is a great question.
I think the answer is taht following temperatures over large areas is basically wasting time, if one wants to make climate claims.
Especially if the temperature anomalies involved are trivial, and have to be massaged, whirled and blended to find any trends at all.
AGW hype has poisoned the well as to accuracy quality and meaning of a lot of weather and climate related data.
|
|
|
|
Puzzle
Mar 16, 2010 16:40:33 GMT
Post by magellan on Mar 16, 2010 16:40:33 GMT
Icefisher Define "grossly inadequate". There has been a statistically significant rise over the 10 years prior to 2004 even taking into account the better coverage provided by the ARGO data. That rise was vastly larger than the statistically insignificant fall since 2004. To use your terminology, monitoring since 2004 has been too "grossly inadequate" to capture any change one way or another. And you still don't understand. There is no "missing heat" being purported. It is accepted that the OHC has not significantly changed. Akasofu's curve is a fictional version of the atmosphere surface temperature. The black line in the following seems to represent one of the latest analyses that demonstrate the variability in OHC. I'm not "moving on". The argument is whether there is an underlying imbalance such that (roughly speaking) the "average" climate we ought to expect will result in resumed warming. It is not some silly idea that there is a mass of warm water has been secretly buried in the deep ocean. I think ideas like that are used by certain sceptics when attempting to defend unscientific hypotheses about long term cycles. Let's see. Hansen et al 2005 stopped their analysis in 2003 and claimed the data was "robust" . Domingues 2008 stops his analysis in 2003. Wasn't data available beyond that? Santer 08 stopped their analysis with 'new and improved' statistics in 1999. Is there a pattern here? You appear to be interpreting the pause or insignificant fall in OHC as an evidence that there is no committed warming. Trenberth has said that there is not enough observational data to determine all the inputs into the energy balance equation. I don't see any evidence that suggests that 6, or even 10 years, is long enough to tell. But there is evidence of previous "pauses", and this may be another. So we're back to saying that current observations do not sufficiently constrain sensitivity. This is getting funny. ARGO was put in place precisely because the older methods were inadequate. Since in place, the large year to year variability compared to the outdated XBT instrumentation is not there. The spacial coverage is far greater as well. The step change in the transition to ARGO in 2002 clearly shows a discontinuity in the data. Also, the step change during that period does not show up in the SST. Now you say that too is inadequate. Hansen says the oceans are the only correct metric to use to analyze earth's energy imbalance, but you say he didn't really mean from 2003-2009. If there is heat being displaced below 750m, it should manifest itself in the steric sea level data. It does not. Answer the question. Since 2003, does OHC in the upper 700m support or refute Hansen et al 2005? Shall we review the paper first? The paper is widely available. The abstract states emphatically: Our climate model, driven mainly by increasing human-made greenhouse gases and aerosols, among other forcings, calculates that Earth is now absorbing 0.85 +/- 0.15 watts per square meter more energy from the Sun than it is emitting to space. This imbalance is confirmed by precise measurements of increasing ocean heat content over the past 10 years. Implications include (i) the expectation of additional global warming of about 0.6 degrees C without further change of atmospheric composition; (ii) the confirmation of the climate system's lag in responding to forcings, implying the need for anticipatory actions to avoid any specified level of climate change; and (iii) the likelihood of acceleration of ice sheet disintegration and sea level rise. So you now say there is no adequate method to properly measure earth's energy imbalance even though Hansen and IPCC says there is. We can therefore assume you agree the IPCC is a load of crap and all this talk about being "90% certain" that humans are responsible for warming of earth's climate the last 50 years is a false statement because we don't know *hit. Did CO2 lose it's mojo? |
|
|
|
Puzzle
Mar 16, 2010 17:16:13 GMT
Post by nautonnier on Mar 16, 2010 17:16:13 GMT
Agree nautonnier: average temperature is not a good measure of climate change or heat content. But it is the one used until we have something better. And what could be better? That depend on what we would like to measure/proof/forecast. If the idea is to monitor climate change do we need to measure "Climate". That is not a easy task but not so difficult as first thought I think it would be rather easy with statistics from the agriculture sector. Which is not as sexy as with satellites but still VERY valid. Measure Heat content. For which purpose? I don't see the direct link to climate for that either. If the heat content increase , is that a result of increased incoming or reduced outgoing amount of energy? We can measure that in the atmosphere but we still don't know the reason for it. If we use the wrong hypothesis to explain our measurements will our conclusion be wrong. We should not use a to simple proxy as temperature for the climate, let us measure the climate direct. And the easiest proxy for climate measurement is to calculate degree days for different climate zones. Back to degree days which i think is the best proxy of Climate. www.ipm.ucdavis.edu/WEATHER/ddconcepts.htmltinyurl.com/yl2tdzv
And what could be better? "What could be better is working out the atmosphere's heat content from its temperature, using the enthalpy of the analyzed atmosphere and its measured water content. see www.engineeringtoolbox.com/enthalpy-moist-air-d_683.htmlPlay with the maths - as everyone here likes to do - see how much extra heat can be held by humid air. Then see how much extra is added by clouds (the article calls clouds - airborne water droplets - 'fog') Now see how a dry or drier airmass can be at a higher temperature than a wet cloudy airmass even though the wet airmass has the same or even a lot more heat content. Sure if we assume the IPCC non reactive slab well mixed atmosphere then it may all average out. But the real atmosphere is NOT well mixed. Air at the poles is drier than air the equator-side of the polar vortex. If that polar vortex stays out of normal position for a long time (as it has for the last few months) then the current simplistic averaging of temperature will show higher averages - despite the actual heat in that part of the atmosphere being lower. So despite the AGW hypothesis being about an 'energy budget' - the energy is not being measured. Is this because the layman's use of 'temperature' makes the AGW argument more effective? I don't know - but like assumptions, definition of metrics is always where to look for basic easily overlooked errors in research. And a quick note for those who want to think things further. Svensmark's clouds if/when they form, would take up heat and cool the atmosphere as well as raise its albedo. What is the effect in terms of heat content of the atmosphere per degree C of a cloud mass say a kilometer deep and say 1,000 square kilometers in extent? Now interpolate that out for most of the Northern hemisphere. Perhaps it only needs sufficient clouds to be formed to push the Earth climate into an ice age. |
|
|
|
Puzzle
Mar 16, 2010 20:10:33 GMT
Post by icefisher on Mar 16, 2010 20:10:33 GMT
Akasofu's curve is a fictional version of the atmosphere surface temperature. The black line in the following seems to represent one of the latest analyses that demonstrate the variability in OHC. Nice chart. But producing an out-of-date ocean surface layer temperature chart hardly fictionalizes Akasofu's atmospheric temperature chart. You keep blabbering that nonsense but never can seem to muster any evidence of your claim. I'm not "moving on". The argument is whether there is an underlying imbalance such that (roughly speaking) the "average" climate we ought to expect will result in resumed warming. It is not some silly idea that there is a mass of warm water has been secretly buried in the deep ocean. I think ideas like that are used by certain sceptics when attempting to defend unscientific hypotheses about long term cycles. Unscientific? Since when does ego-driven speculation trump actual observation as more scientific? It is absolute denialism to suggest there are no long term cycles when all the evidence except a few pieces of carefully sought out burlwood suggests there are longterm natural cycles. Indeed you are "moving on". You are ignoring empirical evidence that suggests you hypothesis is hogwash and continue to advocate your expectations and speculations without bothering to explain how the real world works and you say exactly that above. The precise point is that natural processes do have cycles and fluctuations and it is stronger than CO2 forcing. . . .making it really stupid to suggest all upward temperature change is attributable to one theory and all downward motion to a natural theory. Just like your parents did to bring you into the world natural cycles go down and they go up too!! Indeed Akasofu exposes that. . . .the underlying .5degC per century we haven't seen change direction in either direction. . . . .suggesting its not CO2 driven either. A close look at the data suggests little room for CO2 driven fluctuation. One can speculate on an undiscerned transition at some point in time from LIA recovery to CO2 forcing but that without an explanation for the LIA is bit like speculating a missile emerging from the nose of a 747 a thousandth of a second before it impacted a building. Though if you don't speculate on that one can discern some relationships to changes in the sun and with a Grand Maximum maybe just wrapping up even the little extra push in temperatures might be accounted for leaving virtually nothing for CO2. History is full of smart guys that jumped off barns with a pair of homemade wings but it took a couple of bicycle repairmen in Ohio to observe the need for a 3rd control beyond pitch and roll. Ultimately progress is made by people figuring out how things really do work. What doesn't work are 5 year government plans. And all you need to understand that is look at history too. |
|
|
|
Puzzle
Mar 16, 2010 23:57:49 GMT
Post by aj1983 on Mar 16, 2010 23:57:49 GMT
Wiggle watching again, huh? More on the oceans are cooling argument: www.skepticalscience.com/cooling-oceans.htmBTW, if you take a look at the surface temperatures (e.g. climate4you.com/ , they have been falling and rising several times, but do show a general upward trend. (The downward trend has recently significantly reversed.) |
|
|
|
Puzzle
Mar 17, 2010 1:42:28 GMT
Post by icefisher on Mar 17, 2010 1:42:28 GMT
Wiggle watching again, huh? More on the oceans are cooling argument: www.skepticalscience.com/cooling-oceans.htmBTW, if you take a look at the surface temperatures (e.g. climate4you.com/ , they have been falling and rising several times, but do show a general upward trend. (The downward trend has recently significantly reversed.) And Steve Sez: "There is no statistically significant loss of heat from the ocean. I have not seen a model diagnostic for ocean heat content, but a stable atmospheric temperature even for 10 years is in line with the performance of many models which show similar stable periods *despite* being forced by increasing CO2 and not including any other unknown forcings that might be influencing the real earth." Both of you are ignoring the obvious. The obvious is that there is no requirement for ocean cooling. The skeptic issue of missing heat isn't a claim the oceans have cooled. . . .instead its a claim the oceans have not warmed. . . .and if the oceans have not warmed then the IPCC AGW hypothesis is falsified. The heat that is missing apparently never existed. . . .unless of course you can point to it. After all according to the simple version of the AGW theory the sun shines on the good old earth and CO2 keeps it here. Arguing no statistically significant cooling is an argument for the status quo, not an argument for AGW or Schneider's last big panic an anthropogenic ice age. You guys though persist in intellectual dishonesty regarding the issue. |
|


