|
|
Post by sigurdur on Jun 26, 2010 2:37:11 GMT
Smoothed sunspots and co2 vs temperature: 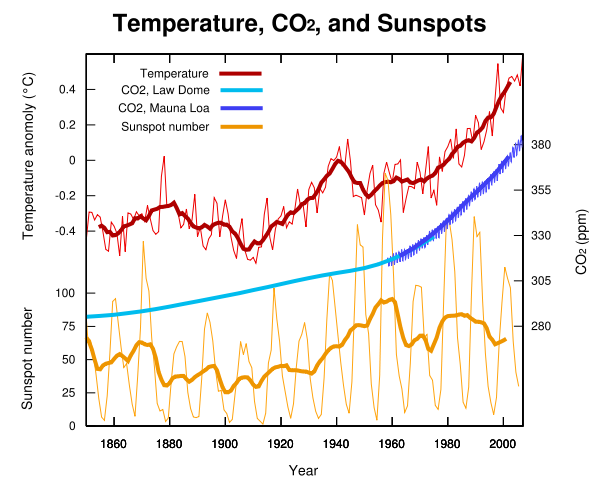 Socold: I don't know where that graph got that temp anomoly, but it sure isn't one that I have seen before. It is way out of whack. Also, the co2 levels have varied much more than the smooth is showing. |
|
|
|
Post by icefisher on Jun 26, 2010 4:12:19 GMT
Smoothed sunspots and co2 vs temperature: Socold: I don't know where that graph got that temp anomoly, but it sure isn't one that I have seen before. It is way out of whack. Also, the co2 levels have varied much more than the smooth is showing. Notice how 1930's global temperature increases cause sunspot activity increases after 1940 LOL! |
|
|
|
Post by glc on Jun 26, 2010 10:04:01 GMT
Notice how 1930's global temperature increases cause sunspot activity increases after 1940 LOL!
That's because sunspot activity has jack all to do with changes in global temperature.
|
|
|
|
Post by socold on Jun 26, 2010 12:51:37 GMT
Smoothed sunspots and co2 vs temperature: Socold: I don't know where that graph got that temp anomoly, but it sure isn't one that I have seen before. It is way out of whack. Also, the co2 levels have varied much more than the smooth is showing. The co2 levels and and temperature record depicted are standard what you'll find elsewhere. No matter which way it is cut, the solar-temperature correlation in the past few decades is abysmal and if skeptics had a iota of the distain they usually have for such lacks of correlation, they would conclude the "sun caused it" line of thinking is falsified. |
|
|
|
Post by sean2829 on Jun 26, 2010 13:46:38 GMT
The sun caused it line of thinking is not simple. No one has ever found a correlation between periods of maximum solar activity and the climate. The only thing that correlates is the length of the cycle. In other words, longer cycles correspond to cooling trends and this has been noted int the mid to upper lattitudes. So if you want to look for solar influence on the climate, look for indications in the valleys of the sun spot count. We are just coming out of one of the longest solar minimums in a centry and look at the weather in the northern lattituds the last 12 months.
|
|
|
|
Post by trbixler on Jun 26, 2010 14:23:21 GMT
Socold: I don't know where that graph got that temp anomoly, but it sure isn't one that I have seen before. It is way out of whack. Also, the co2 levels have varied much more than the smooth is showing. The co2 levels and and temperature record depicted are standard what you'll find elsewhere. No matter which way it is cut, the solar-temperature correlation in the past few decades is abysmal and if skeptics had a iota of the distain they usually have for such lacks of correlation, they would conclude the "sun caused it" line of thinking is falsified. I had trouble finding the Dalton and the Maunder minimums on the chart. Maybe it is a weather chart? |
|
|
|
Post by socold on Jun 26, 2010 15:26:13 GMT
The co2 levels and and temperature record depicted are standard what you'll find elsewhere. No matter which way it is cut, the solar-temperature correlation in the past few decades is abysmal and if skeptics had a iota of the distain they usually have for such lacks of correlation, they would conclude the "sun caused it" line of thinking is falsified. I had trouble finding the Dalton and the Maunder minimums on the chart. Maybe it is a weather chart? If you are arguing that sunspots correlated well with global temperature before 1970, what happened since then? Doesn't that suggest something new is at work? Wonder what that might be. |
|
|
|
Post by socold on Jun 26, 2010 15:29:54 GMT
The sun caused it line of thinking is not simple. No one has ever found a correlation between periods of maximum solar activity and the climate. The only thing that correlates is the length of the cycle. In other words, longer cycles correspond to cooling trends and this has been noted int the mid to upper lattitudes. So if you want to look for solar influence on the climate, look for indications in the valleys of the sun spot count. We are just coming out of one of the longest solar minimums in a centry and look at the weather in the northern lattituds the last 12 months. The correlation between sunspot cycle length and global temperature is equally as bad as between sunspot count and global temperature in recent decades.  Figure 3: the top figure compares temperature to solar cycles. The bottom figure plots the difference between temperature and solar cycle length, showing a strong divergence in the mid 1970s www.dmi.dk/dmi/sr99-9.pdf Figure 3: the top figure compares temperature to solar cycles. The bottom figure plots the difference between temperature and solar cycle length, showing a strong divergence in the mid 1970s www.dmi.dk/dmi/sr99-9.pdfThat image is from 1999, the correlation now is a lot worse given the length of cycle 23 |
|
|
|
Post by sigurdur on Jun 26, 2010 15:30:14 GMT
I had trouble finding the Dalton and the Maunder minimums on the chart. Maybe it is a weather chart? If you are arguing that sunspots correlated well with global temperature before 1970, what happened since then? Doesn't that suggest something new is at work? Wonder what that might be. Correlation is not causation. There are still numerous things that the sun does that we are uncertain about. Much yet to be learned. A few years as an outlier is not enough to tell us anything. In another 100 years, smoothing will erradicate the outlier. |
|
|
|
Post by sean2829 on Jun 26, 2010 15:54:02 GMT
Well you do indeed have a pretty good correlation between cycle length and temp change with about a 7 year lag until as you say the 80's. Since we just had a 12.5 year cycle where the minimum was in late 08, if this effect is real, we'll have a much better handle in 2015.
|
|
|
|
Post by trbixler on Jun 26, 2010 15:54:48 GMT
I had trouble finding the Dalton and the Maunder minimums on the chart. Maybe it is a weather chart? If you are arguing that sunspots correlated well with global temperature before 1970, what happened since then? Doesn't that suggest something new is at work? Wonder what that might be. Just ignore the Dalton and the Maunder maybe the Sporer as well. Something new when we pitch out the history, really. |
|
|
|
Post by trbixler on Jun 26, 2010 16:08:51 GMT
While not new "Pay attention to sunspot forecasts" "We've also known since 1984 that sunspots correlate strongly with abrupt-but-moderate Dansgaard-Oescher cycles in the earth's temperature regime—a 2-4 degree C shift about every 700 years. These changes have produced the Little Ice Age, the Medieval Warming, the Dark Ages, the Roman Warming and a whole series of moderate climate cycles going back at least 1 million years. The sunspot index has a 79 percent correlation with the earth's temperatures since 1860, while CO2 has only a 22 percent correlation. The sunspot index has been predicting global cooling since 2000. " www.enterstageright.com/archive/articles/0610/0610sunspot.htm |
|
|
|
Post by socold on Jun 26, 2010 18:46:13 GMT
If you are arguing that sunspots correlated well with global temperature before 1970, what happened since then? Doesn't that suggest something new is at work? Wonder what that might be. Just ignore the Dalton and the Maunder maybe the Sporer as well. Something new when we pitch out the history, really. You don't have temperature data for the Dalton, the Maunder and the Sporer do you? So how on Earth can you make vague generalizations that solar was correlated with temperature in those periods? And you don't address the question why there is a divergence in the past 30 years. If you want to imply the correlation between sunspots and temperature is evidence of causation, then evidentally the post 1970 (or perhaps 1960) divergence is evidence of a non-solar cause to the warming. Avery doesn't reference anything for his claims about D-O events correlating with solar activity, he's probably running counter to expert knowledge on the subject imo. More importantly though he completely glosses over the fact that sunspot index has been flat since 1970 while there has been significant warming. All suggests he has an agenda and is carefully omitting inconvenient truths. |
|
|
|
Post by trbixler on Jun 26, 2010 22:45:02 GMT
|
|
|
|
Post by glc on Jun 27, 2010 9:47:26 GMT
Neither of these links is very convincing but, that aside, there is a more important issue. First let's dispel the myth that AGW proponents dismiss solar forcing as a cause of climate change. Check out this paper www.sciencemag.org/cgi/content/abstract/294/5549/2149Solar Forcing of Regional Climate Change During the Maunder Minimum Drew T. Shindell, Gavin A. Schmidt, Michael E. Mann, David Rind, Anne Waple Note the names of the authors - Mann, Schmidt, Shindell - You can't get more pro-AGW than these three. The pro-AGW crowd are more than happy to accept that there has been a significant solar influence on past climate - including the early 20th century warming. They have good reason for doing so. If there really is a tight solar/climate link that everyone seems to think exists (e.g. Archibald, L&F-C, Svensmark) then it's clearly broken down since around 1980. This just happens to be at the very point that we might expect the increased ghg effect to start to show up against the background of natural variability. Solar activity peaked in the late 1950s. It's been relatively high since but there has not been any trend. We have had declining activity since the early 1990s. Support for a close solar/climate link implies support for AGW. |
|


