|
|
Post by steve on May 27, 2013 9:17:50 GMT
nautonnier, Been away - hence the delay in response. The question in 2313 would be whether the *average* of all the proxies indicated a warm period for the recent 20 years. Assuming the current warm period ends (due to a big uptick in volcanoes for example) and observations are all lost in the next nuclear war, there may be sufficient high resolution proxies to indicate that the 1993-2013 period was warm. But there may not. If there are not enough high res proxies to prove a 20 year warm period then you would certainly not be able to be sure the current period was warm. In the same way, the current set of proxies cannot find a warmer than now period in the past millennium, but such periods are not ruled out (at the 95+% possibility IIRC). What I'm arguing though is that the co2"science" database is in line with what I say, but is presented to say the opposite and is understood to say the opposite by people taking the co2"science" headlines at face value. Steve, It would appear that there are more 'proxies' showing global LIA. Interesting story here: To the Horror of Global Warming Alarmists, Global Cooling Is HereOh and several people seem to think things will get colder. I seem to remember on the old board talking to you about how long temperatures would need to stay static before you re-examined AGW and that at that time it was 10 years (could have been another 10 years but it was some time ago.) Have you set a date after which if temperatures are still static you would look at things again? The only problem I have with the LIA is the term LIA. Seems that things looked set to gradually cool till all the CO2 got emitted which will wipe out 3 millennia of very gradual cooling in 150 years. Maybe volcanoes made it even cooler for periods. As temperatures are rising (albeit steadily) I expect it will be warmer (in the surface record) this decade than the last. |
|
|
|
Post by icefisher on May 27, 2013 14:06:46 GMT
You continually impress me Steve. I can't imagine how somebody can get it up to spin: "I've mentioned Loehle a few times. He thinks there is one 30 year period that may have been warmer than the preceding 30 year period." into, "In the same way, the current set of proxies cannot find a warmer than now period in the past millennium, but such periods are not ruled out (at the 95+% possibility IIRC)" My English must be screwed up. I read the former to say that Loehle thinks it better than a 50% chance that there was a period in the past 1000 years that was warmer; and I read the latter to say that its not quite 95% certain that there was no warmer period in the last 1000 years. If you get much further apart one would be properly labeled an "absolute flat earther" instead of a "sort of flat earther" . At any rate this should seque nicely into the Ben Santer statistics discussion as well. Icefisher, Different people have different views. That is all there is to it. I'm inclined to believe the 95% possibility. Loehle clearly *thinks* he has found a warmer 30 year period, but his abstract says "The warmest tridecade of the MWP was warmer than the most recent tridecade, but not significantly so[." Translation: the evidence is weak despite my best efforts to find a warm period. And note that the most recent tridecade to now is 0.1C warmer than the most recent tridecade to 2007 (when Loehle's paper was first published). I suspect that has dented his statistic even more. I don't see where you addressed anything about Loehle's evidence or his motivations Steve. Just more mud slinging huh? Loehle's self characterization seems absolutely neutral, much more than can be said of you. "I am not a “denialist” and my recent paper (Loehle, C. and N. Scafetta. 2011. Climate Change Attribution Using Empirical Decomposition of Historical Time Series. Open Atmospheric Science Journal 5:74-86) attributes about 40% of recent warming to human activity – estimating that this equates to a no-feedback atmosphere." "What I would deny is that tree rings are good thermometers, but this is a scientific view based on my knowledge of trees, not a political view." Golly sounds like a real scientist. Of course that ruffles your feathers that he isn't a true believer in Catastrophic AGW. The only problem I have with the LIA is the term LIA. Seems that things looked set to gradually cool till all the CO2 got emitted which will wipe out 3 millennia of very gradual cooling in 150 years. Maybe volcanoes made it even cooler for periods.
As temperatures are rising (albeit steadily) I expect it will be warmer (in the surface record) this decade than the last.
yadda yadda yadda. CET shows as much warming in the 150years prior to 150 years ago as the last 150 years. So even the MWP of the last 1,000 years did not get wiped out in 150 years. One has to wear blinders to not see the saw tooth temperature proxy in ice core studies with fluctuations of up to 4c and averaging something between 2 and 3c. Even if we are in a decline to a period of glaciation something like 9c in 60,000 years (by the icecore record) that works out to about -.15degC/millenium or maybe about how much cooler this warm period is than roughly 1000 years ago. . . .we could be exactly still on track (ignoring the possibility of a double peaked interglacial) and your fears are nothing more than a runaway from the boogeyman shiver. You see Steve it makes sense that one degree in even 3,000 years is too fast of a rate of decline by more than a factor of 2 and most likely we are looking at a 2 degree plus recovery from the LIA. 6,000 years ago when there is no question it was warmer than today. . . .the gradual ice age decline rate should have us less than one degree below the Holocene climate optimum at a peak in the millenium oscillation (of say 2 degrees). We know there was no ice in the arctic for many months a year then and that lasted for a few thousand years thus current temperatures are probably right where they should be. . . .uh . . . .within a degree or two. p.s. I see you expect the current decade to be warmer than the previous decade. Used to be you predicted it would be .2c warmer. Is that prediction dead now? |
|
|
|
Post by nautonnier on May 27, 2013 18:04:47 GMT
Steve, It would appear that there are more 'proxies' showing global LIA. Interesting story here: To the Horror of Global Warming Alarmists, Global Cooling Is HereOh and several people seem to think things will get colder. I seem to remember on the old board talking to you about how long temperatures would need to stay static before you re-examined AGW and that at that time it was 10 years (could have been another 10 years but it was some time ago.) Have you set a date after which if temperatures are still static you would look at things again? The only problem I have with the LIA is the term LIA. Seems that things looked set to gradually cool till all the CO2 got emitted which will wipe out 3 millennia of very gradual cooling in 150 years. Maybe volcanoes made it even cooler for periods. As temperatures are rising (albeit steadily) I expect it will be warmer (in the surface record) this decade than the last. Steve, do you really think that CO2 is the ONLY reason for any warming of the climate? |
|
|
|
Post by steve on May 29, 2013 6:42:29 GMT
The only problem I have with the LIA is the term LIA. Seems that things looked set to gradually cool till all the CO2 got emitted which will wipe out 3 millennia of very gradual cooling in 150 years. Maybe volcanoes made it even cooler for periods. As temperatures are rising (albeit steadily) I expect it will be warmer (in the surface record) this decade than the last. Steve, do you really think that CO2 is the ONLY reason for any warming of the climate? Nautonnier, no I don't "really" think that. Why would I mention volcanoes if I "really" thought that? I "expect" warming because I don't "expect" a massive volcanic eruption in the next 7 years to 2020 (though it's not impossible). I seriously don't expect solar activity in the next 7 years to upset my expectation. If aerosols are influencing the current hiatus/pause/call it what you like I don't expect their influence will override CO2 over the next 7 years. I don't expect other radiative gases to vary radically in any way. I do expect an El Nino to occur sometime within the next 7 years which should lift the annual means comfortably above the recent records. |
|
|
|
Post by steve on May 29, 2013 6:51:13 GMT
Icefisher, Different people have different views. That is all there is to it. I'm inclined to believe the 95% possibility. Loehle clearly *thinks* he has found a warmer 30 year period, but his abstract says "The warmest tridecade of the MWP was warmer than the most recent tridecade, but not significantly so[." Translation: the evidence is weak despite my best efforts to find a warm period. And note that the most recent tridecade to now is 0.1C warmer than the most recent tridecade to 2007 (when Loehle's paper was first published). I suspect that has dented his statistic even more. I don't see where you addressed anything about Loehle's evidence or his motivations Steve. Just more mud slinging huh? Loehle's self characterization seems absolutely neutral, much more than can be said of you. "I am not a “denialist” and my recent paper (Loehle, C. and N. Scafetta. 2011. Climate Change Attribution Using Empirical Decomposition of Historical Time Series. Open Atmospheric Science Journal 5:74-86) attributes about 40% of recent warming to human activity – estimating that this equates to a no-feedback atmosphere." I haven't called Loehle a denialist. He is someone looking hard for evidence of the opposite to the consensus. There is nothing wrong in doing that and there is nothing wrong in pointing out the fact that despite looking hard his evidence supports what I'm saying more than it supports sceptic ideas of a very warm MWP. In my old field of astrophysics there were many such contrarians. They were mostly wrong but they stimulated debate. I checked early pages of the global temperature prediction thread to be sure, but I've been quoting 0.1-0.2C in a decade for quite a few years. |
|
|
|
Post by icefisher on May 29, 2013 7:50:57 GMT
I checked early pages of the global temperature prediction thread to be sure, but I've been quoting 0.1-0.2C in a decade for quite a few years. [/quote] I don't recall the .1 part but I will take your word for it. Perhaps I was overly focusing on the problem of getting 3C per century out of .2C per decade. I assume it presumes huge increases in emissions to gather momentum even at .2c/decade. So perhaps you could elucidate a bit. What does that range equate to for a century, for a doubling of CO2, and is that a range or just natural variability and the prediction is actually .15c to get to the doubling or century. . . .assuming of course the midline emissions assumptions+? |
|
|
|
Post by steve on Jun 1, 2013 8:44:53 GMT
The 0.1-0.2 bit is on the first page or so of the Global temperature prediction thread.
The emissions don't need to "gather momentum". The 0.1-0.2C acknowledged the possibility of "natural variability" and the forecasts for less warming at the time (i.e. the Smith paper). There is enough energy going into the ocean to accelerate this warming if it stops going into the ocean so much. So the rate of warming depends on whether the ocean heat uptake remains consistent.
|
|
|
|
Post by icefisher on Jun 1, 2013 14:09:03 GMT
The 0.1-0.2 bit is on the first page or so of the Global temperature prediction thread. The emissions don't need to "gather momentum". The 0.1-0.2C acknowledged the possibility of "natural variability" and the forecasts for less warming at the time (i.e. the Smith paper). There is enough energy going into the ocean to accelerate this warming if it stops going into the ocean so much. So the rate of warming depends on whether the ocean heat uptake remains consistent. Very good Steve. Using the .1 per decade warming as a benchmark you missed your 2 1/4 year out prediction for 2010 by more than a decade. And since then in the subsequent 2 1/4 years it has worsened by cooling rate more than 3 times your predicted warming rate. It seems clear you were banking on the emergence of an accumulation of heat in the ocean to reverse the natural variability being experienced in 2007 and 8 and it appears you are still waiting for this unseen miracle to suddenly appear. But how much hope can there be. We are at solar maximum and as you can see from the chart above decadal temperature trends are strongly controlled by the solar cycle. During the recent rise to maximum there has been virtually no response by climate. The decadal trend remains strongly negative, almost -.l/decade at a time when during the last 3 cycles it rose to a positive .3/decade (the chart has the trends recorded as per century). As you note the actual warming trend was about .15/decade; currently and in the presence of a rise to solar max (jan2009 forward) the cooling trend works out to -.25/decade. The entire last decade works out to -.07/decade but. . . . Whats next? Well I suppose there might be another couple of years of maximum push in the system before it goes into its normal trend decline. Will the negative trend in the drop to minimum reach the same levels that rises to maximums reached prior to these wild solar changes? 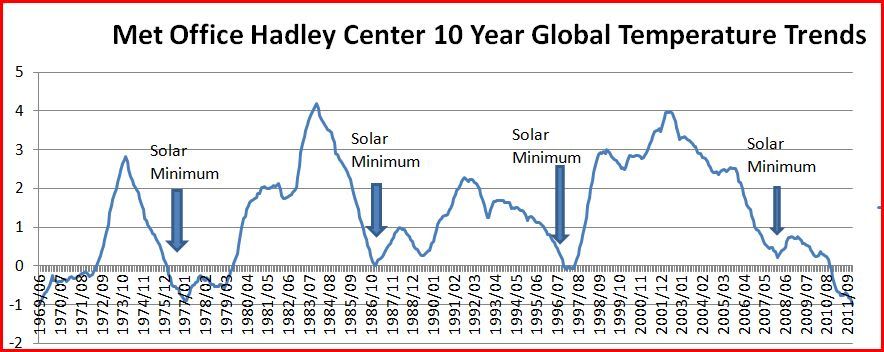 |
|
|
|
Post by neilhamp on Jun 2, 2013 7:40:45 GMT
Icefisher,
Where did that chart come from?
The solar minima correlations look very convincing.
Almost too good to be true.
I presume "decadal temperature trend" means the global temperture trend for the previous 10 years based on HadCRUT4
Can you clarify what is meant by "decadal temperture trend"?
|
|
|
|
Post by icefisher on Jun 2, 2013 17:29:34 GMT
Icefisher, Where did that chart come from? The solar minima correlations look very convincing. Almost too good to be true. I presume "decadal temperature trend" means the global temperture trend for the previous 10 years based on HadCRUT4 Can you clarify what is meant by "decadal temperture trend"? I created it. Data source is the monthly series Hadcrut3 from www.metoffice.gov.uk/hadobs/hadcrut3/diagnostics/global/nh+sh/It can be replicated by appling a monthly overlapping 10yr linear trend function (=linest() in Excel), This provides the blue data line and then I just plotted the solar minimums over it. The 10 year trends are strongly influenced by 11 year solar cycle as you extend the series out to 30 years the bumps pretty much disappear. All you need to attribute it all to solar is a robust ocean delay that allows for a series of strong solar cycles (e.g. the grand maximum of the 20th century) to keep the trend positive. However, since it dips to the negative back in the last cold PDO (late 1970's) and again now, could be an indicator of the multi-decadal ocean oscillations. Since the PDO started its downward decline in 1993 and seems to have crossed the zero line around 2010 combined with the lack of a strong cycle 24 maximum I am thinking cooling is just a year or two away. If you plot the solar maximums on the graph you will find the solar maximums come before the peaks. Thats probably due to ocean momentum. However, the minimums correspond really well with the valleys. I have not analyzed that but I suspect its due to a strong longer term ocean momentum that is still positive at the end of a solar cycle. The ocean momentum question is rather complex and the best article I have read on it suggests as seems logical that ocean momentum has two different overlapping processes. One is upper ocean mixing (wind and storm driven) and the other is deep ocean effects (probably a thermohaline convection cycle) I think this graph provides strong evidence that solar has been underestimated. More evidence is needed though to explain why it has stayed above the zero line so much. LIA recovery seems to be the best explanation. . . .a solar process moving from a series of Grand Minimums culminating with the Maunder Minimum to the rewakening of the sun and its gradual and uneven climb to the 20th century grand maximum. If thats true then until we know how the sun works we will not be able to predict climate, though the astrometeorologists have not done a bad job over the past 300 years but they really have no record of predicting the general direction the sun is going to take they have done a credible job on shorter time scales. It has been clear to me that solar is the dominant driver. NOAA has a page somewhere with some more robust smoothing that has solar tracking temperatures over the past century and a half. That was pooh poohed by the NGO funded climate nuts for coming untracked in recent decades but I see that as an end of series smoothing padding problem. If you don't know what the driver is and what its going to do you can't pad the end of a series properly and if you know what the driver is you can't use padding based on that belief as evidence of the driver meaning for long term scenarios, like determining when solar is at maximum you have to wait for all the smoothing to unwind, put in the data results and see if its still tracking. |
|
|
|
Post by trbixler on Jun 3, 2013 5:20:53 GMT
icefisher
Great work. What is also interesting is how an interested party can create an interesting view that has not been particularly mentioned by the "experts". Again, very nice and very interesting work.
|
|
|
|
Post by cuttydyer on Jun 3, 2013 7:36:40 GMT
Icefisher, Where did that chart come from? The solar minima correlations look very convincing. Almost too good to be true. I presume "decadal temperature trend" means the global temperture trend for the previous 10 years based on HadCRUT4 Can you clarify what is meant by "decadal temperture trend"? Neil, The notorious UK winter of 1962/63 was also a solar minimum Winter:  There are many examples of historical NH cold events that also coincide with solar minimums. The Netherlands "Elfstedentocht" 200 kilometres speed skating match (held at most once a year, only when the natural ice along the entire course is at least 15 centimetres (6 in) thick; sometimes on consecutive years, other times with gaps that may exceed 20 years):  The Rhine freezing over:  Link: www.sen.com/news/link-found-between-cold-winters-and-solar-activity.htmlRising wheat prices:    Link: arxiv.org/abs/astro-ph/0312244If Dr Habibullo Abdussamatov's ( Director of the Pulkovo Observatory in St Petersburg, and also the Director of the Russian segment of the International Space Station) solar forecast is correct, the Winters around 2018 are going to be harsh:  Link: www.gao.spb.ru/english/astrometr/index1_eng.html |
|
|
|
Post by steve on Jun 6, 2013 6:00:01 GMT
Icefisher,
So if your plot is demonstrating anything, it is demonstrating that the (mostly upwards) trend was 0.2C/decade larger during the last solar max than the one before (Cycle 22).
So given the current low solar max, and given the variability in the trends, the trend being 0.2C lower than Cycle 22 is not indicative of anything much.
I'm a patient person. It would be nice to better tie down the actual causes of variability to their specific components (heat uptake, aerosols, solar or the effects of two or more of these combined), but in the meantime the variability is not indicative of the trend changing much and is reasonable as compared with what models can potentially demonstrate.
|
|
|
|
Post by icefisher on Jun 6, 2013 18:24:13 GMT
Icefisher, So if your plot is demonstrating anything, it is demonstrating that the (mostly upwards) trend was 0.2C/decade larger during the last solar max than the one before (Cycle 22). So given the current low solar max, and given the variability in the trends, the trend being 0.2C lower than Cycle 22 is not indicative of anything much. I'm a patient person. It would be nice to better tie down the actual causes of variability to their specific components (heat uptake, aerosols, solar or the effects of two or more of these combined), but in the meantime the variability is not indicative of the trend changing much and is reasonable as compared with what models can potentially demonstrate. Steve, I don't disagree much with what you say above. But I might add that the variability in cycle 22 cause is known. It was the eruption of Mt Pinatubo in the Phillipines. In cycle 24 its probably. . . . uh. . . . the low cycle. Thats not much of a stretch since the minimum eats the heart out 10 year trends. The nice thing about 10 year trends is they exhibit the influence of the sun while not eliminating but filtering shorter trends and longer trends. Its a reasonable jump that if solar activity going from a minimum to a maximum influences the average temperature on earth a low solar cycle will also, though cycle 23 was less than cycle 22 its also true other effects can override solar effects. . . .so we know the effect of a major stratospheric volcanic eruption also. Additionally the solar graph published here by Cuttydyer correlates well with 30 year trends (at least up to the midpoint of those trends recently to 1998) with our available instrument records with about half the modern warming coming prior to 1850. It seems a reasonable bet at this juncture that once another 15 years goes by the solar record will likely correlate well with instrument record through this year. |
|
|
|
Post by cuttydyer on Jun 30, 2013 8:37:53 GMT
Analysis finds the Medieval Warming Period was global and unrelated to CO2 A new paper from SPPI & CO2 Science:  The Schtick reports: The Medieval Warm Period (MWP) was a global climatic anomaly that encompassed a few centuries on either side of AD 1000, when temperatures in many parts of the world were even warmer than they are currently. The degree of warmth and associated changes in precipitation, however, varied from region to region and from time to time; and, therefore, the MWP was manifest differently in different parts of the world. How it behaved in Russia is the subject of this Summary. In contradiction of another of Mann et al.'s contentions, Krenke and Chernavskaya went on to unequivocally state - on the basis of the results of their comprehensive study of the relevant scientific literature - that “the Medieval Warm Period and the Little Ice Age existed globally.” The fact that the warming that brought the world the Current Warm Period began around 1750 AD, or nearly 100 years before the modern rise in atmospheric CO2 concentration, should be evidence enough to argue that the planet's current warmth is the result of nothing more than the most recent and expected upward swing of this natural climatic oscillation. From approximately AD 1200 to 1410, they concluded that temperatures in the region of their study were “probably higher than today,” providing yet another example of times and places when and where low-CO2 Medieval Warm Period temperatures were likely higher than high-CO2 Current Warm Period temperatures. In conclusion, and considering the full spectrum of studies included in this Summary, it would appear that a goodly portion of the Medieval Warm Period throughout Russia was somewhat warmer than what has so far been experienced there during the Current Warm Period. And since the MWP held sway when the atmosphere's CO2 concentration was something on the order of 285 ppm, as compared to the 400 ppm of today, it would appear that the air's CO2 content has had essentially nothing to do with earth's near-surface air temperature throughout the entire Holocene, when the air's CO2 concentration at times dropped as low as 250 ppm. Other factors have clearly totally dominated. Report link: scienceandpublicpolicy.org/images/stories/papers/originals/medieval_warm_period_russia.pdfSchtick link: hockeyschtick.blogspot.co.uk/2013/06/analysis-finds-medieval-warming-period.html |
|


