|
|
Post by nautonnier on Feb 16, 2019 10:30:47 GMT
So what happens if the baseline year is a little further back than 1976? " Both Arctic & Antarctic Sea Ice Now at Historic HIGH Levels
Contrary to claims that modern day sea ice changes are “unprecedented”, alarming, and well outside the range of natural variability, biomarker proxies used to reconstruct both Arctic and Antarctic sea ice conditions since the Early Holocene increasingly reveal that there is more extensive Arctic and Antarctic sea ice during recent decades than for nearly all of the last 10,000 years.
Antarctic Sea Ice Extent
According to Comiso Et Al., 2017, “Antarctic Sea Ice Extent Has Been Slowly Increasing Contrary To Expected Trends Due To Global Warming And Results From Coupled Climate Models.”
‘After A Record High Extent In 2012 The Extent Was Even Higher In 2014. … [T]He Trend In Sea Ice Cover Is Strongly Influenced By The Trend In Surface Temperature [Cooling].”www.iceagenow.info/both-arctic-antarctic-sea-ice-now-at-historic-high-levels/ |
|
|
|
Post by fatjohn1408 on Feb 16, 2019 18:58:17 GMT
Arctic sea ice extent is about to surpass the 2017 Maximum, which was the lowest since satellite measurements began.
2017 low was 14.42 million square kilometers. Currently, sea ice extent stands at 14.39 million square kilometers.
I keep track of a couple of cities along the arctic:
Temperatures in Moermansk (Russia), St Johns (Canada), Lulea (Sweden) and Anadyr (Russia) are going to drop in the coming days whilst temperatures in Anchorage (Alaska), Akureyri (Iceland) (not really close to ice atm) are going to rise.
Meanwhile Magadan (russia) is going to stay very cool.
So this amateurish assessment would conclude sea ice extent is going to continue to expand and smash both the 2017 and 2018 maximum extent in the next week.
|
|
|
|
Post by Ratty on Feb 17, 2019 13:32:42 GMT
Arctic sea ice extent is about to surpass the 2017 Maximum, which was the lowest since satellite measurements began. 2017 low was 14.42 million square kilometers. Currently, sea ice extent stands at 14.39 million square kilometers. I keep track of a couple of cities along the arctic: Temperatures in Moermansk (Russia), St Johns (Canada), Lulea (Sweden) and Anadyr (Russia) are going to drop in the coming days whilst temperatures in Anchorage (Alaska), Akureyri (Iceland) (not really close to ice atm) are going to rise. Meanwhile Magadan (russia) is going to stay very cool. So this amateurish assessment would conclude sea ice extent is going to continue to expand and smash both the 2017 and 2018 maximum extent in the next week. Where are you extent figures from, FJ1408? |
|
|
|
Post by fatjohn1408 on Feb 17, 2019 13:57:20 GMT
|
|
|
|
Post by nautonnier on Feb 17, 2019 16:19:04 GMT
An easy way in is to go to WUWT and use the reference links that Anthony has put there. wattsupwiththat.com/page/3/It doesn't have all the references but a lot of them. |
|
|
|
Post by Ratty on Feb 18, 2019 0:21:10 GMT
I wonder why NSIDC think that the maximum has been reached. DMI have a slightly rosier picture, maybe? 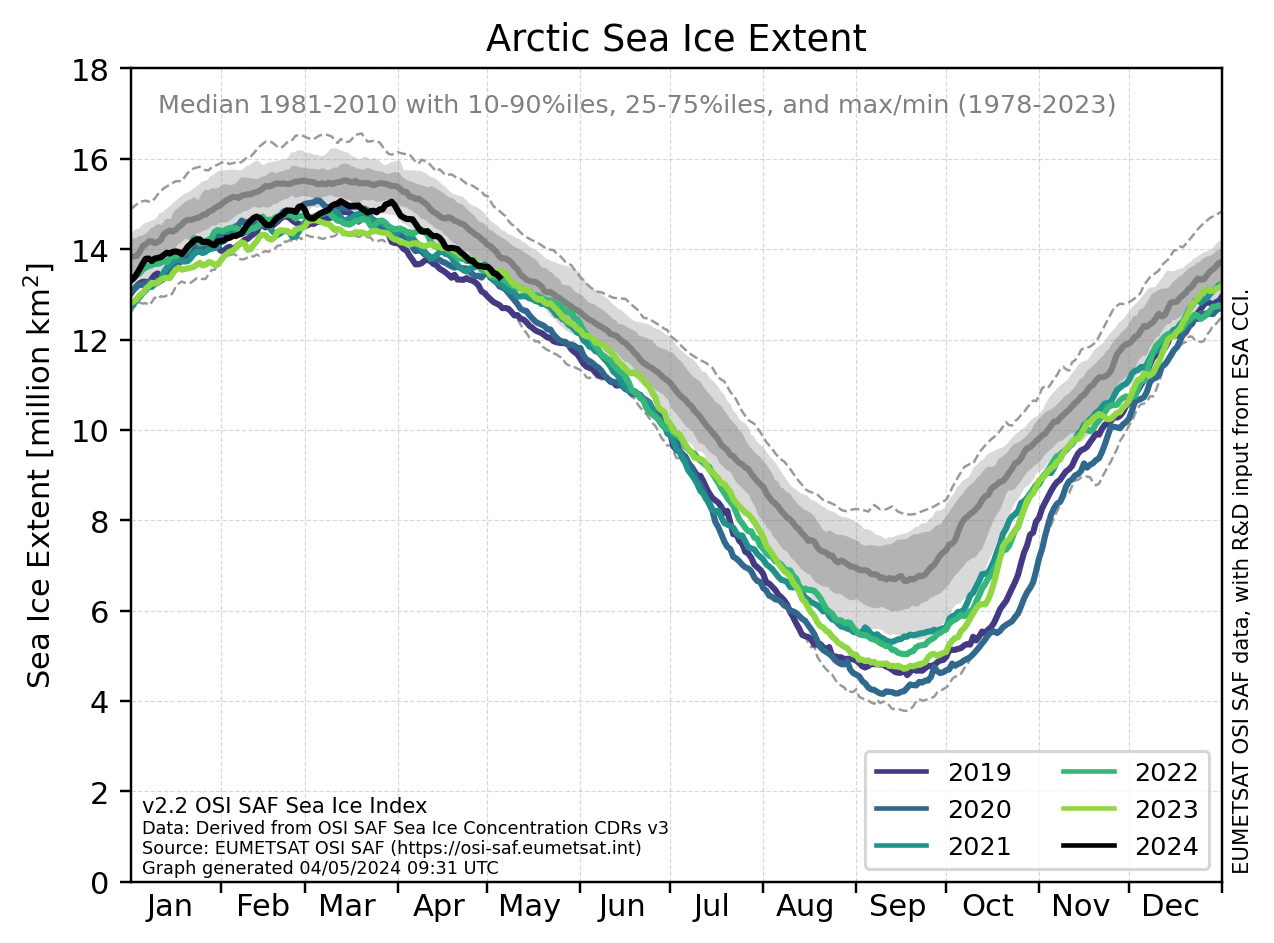 |
|
|
|
Post by fatjohn1408 on Feb 18, 2019 10:23:26 GMT
I wonder why NSIDC think that the maximum has been reached. DMI have a slightly rosier picture, maybe? NSIDC doesnt think the maximum has been reached. I'm afraid you misunderstood my first message. Today the current sea ice extent (which is likely not the maximum yet) stands at 14.17 million km^2 and is likely to surpass the 2017 and 2018 maximum values. The numbers for this year I just take from the graph that gets updated daily: nsidc.org/arcticseaicenews/charctic-interactive-sea-ice-graph/Sea ice extent is fairly low in the bering strait and around nova zembla and Spitsbergen. Most arctic area's seem to have a couple of fairly cold days ahead till thursday/friday so we'll definitely see sea ice extent rise quite a bit. After that we'll probably see a first dip in arctic sea ice extent with mainly the baltic and the area around spitsbergen getting warmer. |
|
|
|
Post by Ratty on Feb 18, 2019 12:33:45 GMT
[ Snip] I'm afraid you misunderstood my first message.[ Snip] Yes, I did.  |
|
|
|
Post by douglavers on Feb 18, 2019 21:04:43 GMT
|
|
|
|
Post by fatjohn1408 on Feb 21, 2019 15:15:17 GMT
Arctic ice at 14.54 million km^2 today Already superceded the 2015, 2016, 2017 and 2018 maximum extents of 14.52, 14.52,14.42 and 14.48 million km^2 respectively. Making this the largest arctic ice extent of the last 5 years. Next lowest, the 2011 maximum of 14,67 will probably fall tomorrow. Cant really say if it will stop rising immidiately. Temperatures around Spitsbergen where there is not a lot of ice will drop significantly next week the rest will be a bit warmer, not enough to melt perhaps. The baltic will start melting though with temps getting up to 7 degrees but it wont offset the rest of the arctic. I am kinda hoping the extent will grow to 15,4 million which would make it the largest since 2003. nsidc.org/arcticseaicenews/charctic-interactive-sea-ice-graph/nsidc.org/arcticseaicenews/2018/03/arctic-sea-ice-maximum-second-lowest/ |
|
|
|
Post by wheels59 on Feb 21, 2019 17:07:16 GMT
There appears to be two patches of anomolously warm water either side of Spitzbergen/Svarlbard, quite likely geothermal activity possibly rifting that has been going on for quite a while now, maybe over a year certainly many months, that could be the reason for low ice formation in the area. You can check it out on Null school ssta
|
|
|
|
Post by missouriboy on Feb 22, 2019 5:32:31 GMT
There appears to be two patches of anomolously warm water either side of Spitzbergen/Svarlbard, quite likely geothermal activity possibly rifting that has been going on for quite a while now, maybe over a year certainly many months, that could be the reason for low ice formation in the area. You can check it out on Null school ssta I remember noticing that a while back. I've often wondered how much geothermal heat is delivered to the overlying water column from that very active tectonic area. Nobody ever seems to mention it. Good catch. Any speculation on or sources regarding its effect? The charts on climate4you seem to show an otherwise out-of-line continuing temperature increase in those general areas. If low solar translates into more tectonic activity, then increasing geothermal heat in these areas might be expected. Although the 1960s and 70s showed lower heat overall.  |
|
|
|
Post by wheels59 on Feb 22, 2019 7:39:51 GMT
It's been going on so long now as I mentioned and so localised that I can only think it's got to be volcanic in origin.Could it mean new islands might appear in the arctic? Does anybody know if Svalbard has a volcanic past? It seems to look like a new volcanic hot spot might have formed to me.
|
|
|
|
Post by fatjohn1408 on Feb 22, 2019 10:30:00 GMT
There appears to be two patches of anomolously warm water either side of Spitzbergen/Svarlbard, quite likely geothermal activity possibly rifting that has been going on for quite a while now, maybe over a year certainly many months, that could be the reason for low ice formation in the area. You can check it out on Null school ssta Cant believe I forgot about that site. Very interesting. Still looks great in the arctic imo. Bering strait, baltic and coast of greenland will warm but Svarlbard will cool and also the sea of okhotsk will cool even further this is where the largest increases in the past weeks took place. The Newfoundland area seems to stay cool as well Also antarctic seems to be close to the end of the melt season with a wave of cold air forecasted to escape the continent into the Weddell Sea. At the moment Ice extent is the 7th lowest in the satellite era. Global sea ice seems to have bottomed making it the 6th lowest global sea ice extent on record higher then 2011, 2016, 2006, 2017 and 2018 Also the minimum took place the earliest since 2006. Source: ads.nipr.ac.jp/vishop/#/extent |
|
|
|
Post by nautonnier on Feb 25, 2019 3:08:33 GMT
" Greenland’s Linear Trend “Bare Ice Area” Rises 36% Since 2000
The globe’s surface has warmed over the past 140 years by almost 1°C, but that too is well within the natural range of variability over the Holocene.
Schneefan (Snowfan) here posted a chart on the Greenland ice cover, noting that “bare ice area of Greenland has been rising since measurements began in the year 2000″:
"notrickszone.com/2019/02/24/expanding-arctic-ice-greenlands-bare-ice-area-rises-36-since-2019/ |
|


