|
|
Post by Ufasuperstorm on Aug 5, 2015 14:29:27 GMT
Two words ; Bottom Melt. When did this 3rd of the season depend solely on 'air temp'  The record levels of sunshine/temps over July may well have proved sufficient to offset the cool May/June esp. with the pack so fragmented over that month. As the OBuoy Buoys show us bottom melt has really taken off across Beaufort ( 70cm basal loss over 1 week!!!) as the storm pushes ice toward the ( relatively)super heated coastal waters. The only ice showing promise is C.A.B. but this is also now showing thinning and disintegration? The Beautfort has seen an increase of 1,932.96 square kilometers over the past 13 days. Day 204 we had 866733.79 square kilometers of MASIE sea ice extent in the Beautfort. Day 216 which was yesterday we had 868666.75 of MASIE sea ice extent in the Beautfort. (866733.79 square kilometers - 868666.75 square kilometers = -1,932.96 square kilometers) I find it quite amusing that with this reverse dipole now you are claiming the waters of the coast of northern Canada will quickly melt the ice. You do realize how shallow the waters are off the northern coast of Canada and how easily they are moderated? sidads.colorado.edu/DATASETS/NOAA/G02186/masie_extent_sqkm.csv (copy and paste this link) 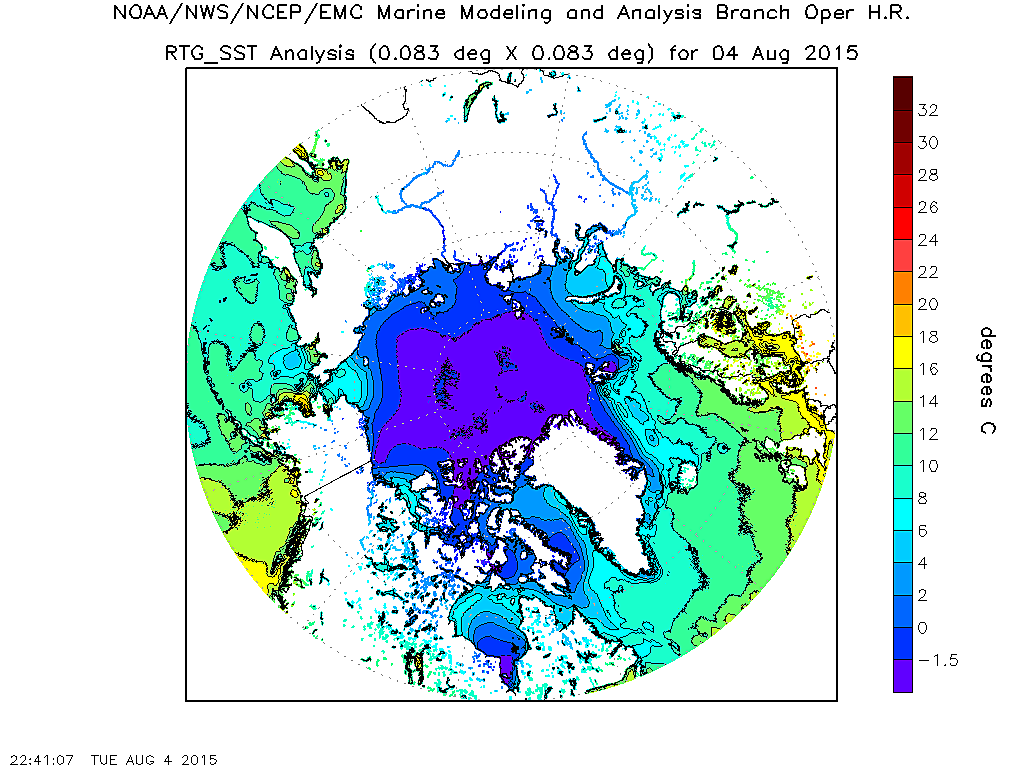 polar.ncep.noaa.gov/sst/ophi/color_sst_NPS_ophi0.png polar.ncep.noaa.gov/sst/ophi/color_sst_NPS_ophi0.png |
|
|
|
Post by sigurdur on Aug 6, 2015 1:16:07 GMT
We are about to flatline melting, and was thinking...........
Has Hudson Bay melted out yet? IF not, that really screws up supply missions.
|
|
|
|
Post by graywolf on Aug 6, 2015 9:02:07 GMT
It is the last of the ice in Baffin causing issues? ( resupply of the islands).
First sight of a bit of trouble on the horizon! The storm , currently off Hawaii, is progged to pay a visit to the basin, via Bering, as the remnants head north. Though a week or so later than GAC12 could we be looking at a similar 'strong' event in the latter part of the month?
|
|
|
|
Post by Ratty on Aug 6, 2015 12:49:44 GMT
It is the last of the ice in Baffin causing issues? ( resupply of the islands). First sight of a bit of trouble on the horizon! The storm , currently off Hawaii, is progged to pay a visit to the basin, via Bering, as the remnants head north. Though a week or so later than GAC12 could we be looking at a similar 'strong' event in the latter part of the month? It will be interesting to watch:  |
|
|
|
Post by slh1234 on Aug 6, 2015 13:34:32 GMT
It is the last of the ice in Baffin causing issues? ( resupply of the islands). First sight of a bit of trouble on the horizon! The storm , currently off Hawaii, is progged to pay a visit to the basin, via Bering, as the remnants head north. Though a week or so later than GAC12 could we be looking at a similar 'strong' event in the latter part of the month? I'm going to reply to you, but honestly, I'm not sure I understand what you post. I'm not trying to just be snarky, but in all honesty, I often look at what you post and think to myself, "All of those words are English words, but there's no way that's an English sentence." I don't fully understand what you're trying to say in this post, but I currently live in Busan where we have had 3 tropical storms or Typhoons thus far this year, and we had several last year as well, so I'm pretty in tune to what I'm seeing with the projections on tropical typhoons. Here is the current storm "Guillermo" which is off of Hawaii: What I see when I look at that is that the storm is currently a tropical storm (The classification given when maximum sustained winds are between 39 and 73 MPH), and it is currently weakening so that by by Friday morning my time, it will be classed as a Tropical Depression (maximum sustained winds below 39 MPH). It's really still taking a mostly westerly course. What I've seen thus far this year is that the projections on path stay pretty accurate when it is going east-west, but as the storms take a turn to the north, they generally slow down, and drift off to the east of the projected path, and dissipate. That's been the pattern around Korea and Japan thus far this year. It doesn't really look like it's going anywhere near the Bering Strait by current projections. Those projections can change, of course (and I've seen them change on storms this year and last), but it doesn't appear to be on a course where it will affect the Bering Strait, and it is currently dissipating, and not strengthening. It will hit a lot of cooler water if it goes toward the Bering Strait, will it not? So if you don't mind, can you use something close to the version of English that I can understand, and explain your concerns a little more clearly? |
|
|
|
Post by nautonnier on Aug 6, 2015 13:38:03 GMT
And every day that storm progresses it takes more energy than 200 times the world generation capacity of electricity from the sea and pumps it into the upper atmosphere and then to space. " An average hurricane produces 1.5 cm/day (0.6 inches/day) of rain inside a circle of radius 665 km (360 n.mi) (Gray 1981). (More rain falls in the inner portion of hurricane around the eyewall, less in the outer rainbands.) Converting this to a volume of rain gives 2.1 x 1016 cm3/day. A cubic cm of rain weighs 1 gm. Using the latent heat of condensation, this amount of rain produced gives 5.2 x 10¹⁹ Joules/day or 6.0 x 10¹⁴ Watts. This is equivalent to 200 times the world-wide electrical generating capacity - an incredible amount of energy produced! " http://www.aoml.noaa.gov/hrd/tcfaq/D7.html |
|
|
|
Post by slh1234 on Aug 6, 2015 13:59:12 GMT
And every day that storm progresses it takes more energy than 200 times the world generation capacity of electricity from the sea and pumps it into the upper atmosphere and then to space. " An average hurricane produces 1.5 cm/day (0.6 inches/day) of rain inside a circle of radius 665 km (360 n.mi) (Gray 1981). (More rain falls in the inner portion of hurricane around the eyewall, less in the outer rainbands.) Converting this to a volume of rain gives 2.1 x 1016 cm3/day. A cubic cm of rain weighs 1 gm. Using the latent heat of condensation, this amount of rain produced gives 5.2 x 10¹⁹ Joules/day or 6.0 x 10¹⁴ Watts. This is equivalent to 200 times the world-wide electrical generating capacity - an incredible amount of energy produced! " http://www.aoml.noaa.gov/hrd/tcfaq/D7.htmlA few people here have told me about local tradition that tells of several stages of typhoons passing through. They even give names in Korean for each phase ... but at the moment, I can only remember one of the names. In the first phase, usually beginning 3 - 2 days before the typhoon arrives, the winds pick up and start to get high. It is usually warm wind, too from my experience. We can go from chilly days, then the wind may pick up, or the nature of the wind may just go from chilly wind to warm wind. Starting about that 3 - 2 days before the main arrival, these winds can get high enough that it is hazardous to keep our windows open in the high-rise where I live. The winds pick up, and the storm surge comes in if we're going to be majorly affected by the storm. The storm surge in the sea is usually noticeable in tide levels at least one tide-cycle before arrival if we're going to take a significant hit. Then is the violence of the typhoon itself. We had some good ones last year, but the first one we took this year was supposed to follow the coast of China by original projections. It actually veered East and just missed the western edge of Korea as it went on up the Yellow Sea. It was strong enough that on the Southeastern tip of Korea, the wind absolutely ROARED around this building when it was at it's closest point. It blew open a vent in my heater room that I didn't even realize was a vent, and moved my wife's potted plant out of the way when it did. I was able to close it easily enough, though. The building is pretty safe so long as you don't leave a window open, and none of your neighbors above you leave a window open (One window got torn off in a storm two weeks ago, and you could see where the detached window was blown back into the building about two stories, and 20 - 30 feet to the side of it's original position. Impressive, really.) After the typhoon passes, we get high winds, but strangely, it is much drier than it was as the typhoon was approaching. And maybe 2 days after the typhoon passes, the air goes dead still, and it gets hot and sticky, and stays like that until another weather pattern changes it. After our first typhoon, two days after the typhoon passed, the air came to life because we had another typhoon approaching.  The amount of rain and wind is impressive ... and gets to the point that you can't really see any distance. I love storms, and I've loved these as they've passed. |
|
|
|
Post by acidohm on Aug 6, 2015 15:29:37 GMT
It is the last of the ice in Baffin causing issues? ( resupply of the islands). First sight of a bit of trouble on the horizon! The storm , currently off Hawaii, is progged to pay a visit to the basin, via Bering, as the remnants head north. Though a week or so later than GAC12 could we be looking at a similar 'strong' event in the latter part of the month? So if you don't mind, can you use something close to the version of English that I can understand, and explain your concerns a little more clearly? I think the word to use with Graywolf is 'excited' A bit like when my six year old gets excited and becomes hard to understand..... Tho why envisioning perceived impending doom and possible Apocalypse is something to get excited about i have no idea...... |
|
|
|
Post by walnut on Aug 6, 2015 16:41:29 GMT
And when the apocalypse never seems to bear out, you need to jump on the fake data bandwagon, and that must feel hollow and unfulfilling. The life of a global warming propagandist.
|
|
|
|
Post by sigurdur on Aug 6, 2015 18:22:13 GMT
slh1234: I remember the typhoons when I was on Guam. Only diff between a typhoon and monsoon was the rain lasted longer and it was windy. Being from North Dakota where we get straight line winds over 100mph, the little gusts during a typhoon were enjoyable. During monsoon, when it rained hard you couldn't see 5' in front of you. Same during a typhoon. The natives just laughed at some of the newcomer reactions. |
|
|
|
Post by douglavers on Aug 7, 2015 4:44:15 GMT
[" An average hurricane produces 1.5 cm/day (0.6 inches/day) of rain]
Nautonnier,
I hate to say this but most hurricanes I have heard about produce far more - I think your decimal point might be mislocated!!
|
|
|
|
Post by phydeaux2363 on Aug 7, 2015 16:16:19 GMT
July Piomas is out and puts us lower in volume than 2014 and catching up on 13'. Also today's drop on JAXA ( 117 km) puts us joint 3rd lowest on the plot. So yesterday the global, arctic and Antarctic area and extent all ticked upward. That must mean we have avoided our doom and are all going to be OK, since what happens on any given day with respect to polar ice extent controls the future, right Mr. Wolf? |
|
|
|
Post by acidohm on Aug 7, 2015 16:36:20 GMT
I'm personally concerned to see the cold outbreaks pushing so far north Ratty. As with our hemisphere it seems that cold is not 'growing' out of the pole but swapping mild/moist air masses for the cold over the continent (WAA). As we saw with the huge Antarctica sea ice drop when the first snows came to confuse Wallaby's a few weeks back? I can promise you that you do not want to be part of the 'stuck weather' phenomena! The eastern Seaboard of the U.S. looks no different than the last two years so in 5 months we'll be hearing about the Arctic conditions gripping the east whilst Alaska ships in snow for it's sled races!!! With the ending of the so called 'hiatus' I think we might even expect Antarctic Sea ice levels to begin to settle back to 1980's levels before its eventual collapse ( Ross Sea first) later in the 20's? EDIT: As far as the Arctic Basin is concerned I'm keeping an eye on the 'cane just about to miss Hawaii? The recurve ,as it dies, runs it up through Bering ( around the triple R). With the ice in such disarray in Beaufort/ESS any low entering through the straights will allow major wave formation and damage to the remaining floes. The current low has seen 70cm of bottom melt of OBuoy9 since the onset of the storm ( 'eckman pumping' of the warmer bottom waters???) so anything larger will do far more damage ( GAC12 wiped out the freshwater pool over the Gyre in less than 5 days!!!). Anyhow , with the sun now much weaker we enter into the bottom melt end of the season and find out what type of momentum we built up through June/July. Whilst June was nothing special July has been breaking both heat and sunshine levels over the basin so any open waters have had a good sunbathe!! How did that bit about hawaiian hurricanes work out Graywolf??? |
|
|
|
Post by nautonnier on Aug 8, 2015 9:00:34 GMT
And when the apocalypse never seems to bear out, you need to jump on the fake data bandwagon, and that must feel hollow and unfulfilling. The life of a global warming propagandist. Well I tend to agree - but it was not my point but NASA's. To be fair they were averaging the rainfall over the entire diameter of the hurricane and not only the eye-wall. however. if you want to move the decimal point in that direction then the hurricanes will be taking 2000 times the electricity generation capacity..... even more impressive.  |
|
|
|
Post by walnut on Aug 8, 2015 13:25:56 GMT
Oh, don't worry I was not talking about the hurricane comment you made. And when the apocalypse never seems to bear out, you need to jump on the fake data bandwagon, and that must feel hollow and unfulfilling. The life of a global warming propagandist. Well I tend to agree - but it was not my point but NASA's. To be fair they were averaging the rainfall over the entire diameter of the hurricane and not only the eye-wall. however. if you want to move the decimal point in that direction then the hurricanes will be taking 2000 times the electricity generation capacity..... even more impressive. |
|


 The record levels of sunshine/temps over July may well have proved sufficient to offset the cool May/June esp. with the pack so fragmented over that month. As the OBuoy Buoys show us bottom melt has really taken off across Beaufort ( 70cm basal loss over 1 week!!!) as the storm pushes ice toward the ( relatively)super heated coastal waters.


