|
|
Post by acidohm on Nov 25, 2016 6:09:05 GMT
I think Rattys meme covers it!! 😆
|
|
|
|
Post by missouriboy on Nov 26, 2016 1:43:21 GMT
Winters you can get over. I think I'd be more concerned about growing seasons that look like 2015 and worse. Note the 100 year CET period from 1810 to 1920 with a large proportion of unusually cold summers. HAPPY THANKSGIVING Y'ALL 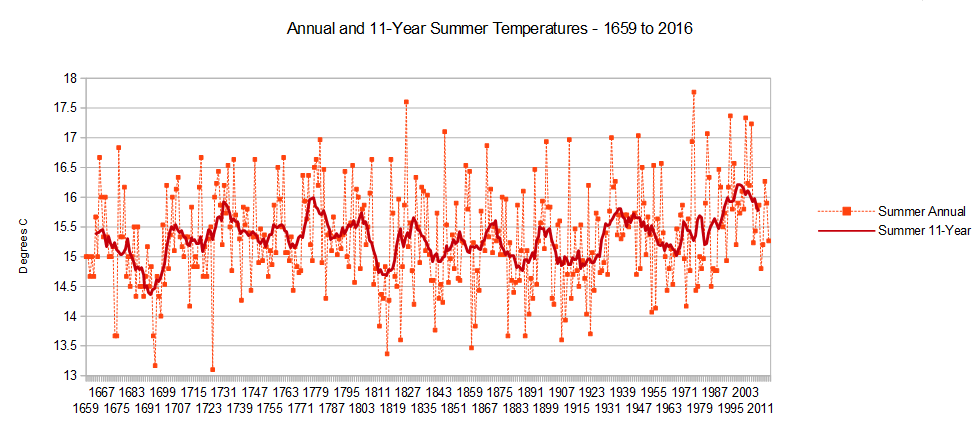 |
|
|
|
Post by missouriboy on Jan 9, 2017 3:11:22 GMT
The surface of the north atlantic hasn't been as cool this year, you think Mboy?? VERY interesting to see the subsurface temps and of course, who knows what has gone on under the surface.... More and more however, I'm looking east for signs of a cold wrather pattern for N Europe.... (still learning here 😉) Blocking the westerly atlantic flow and allowing cold air to draw over us from siberia/Scandinavia is what really gives us a drop in temps. The polar vortex, stratospheric conditions and jetstream are all combining in some way to generate blocking conditions For now, anyway, any westerly air is still way warmer then freezing and moisture laden so wet and windy (booooo!!) Be interesting to see what happens next spring.... Still NO Argo updates since the last release for June. I suppose I should call someone ... and come Jan. 21 perhaps I can complain to the appropriate NEW folks in the NEW administration.  I can't believe there's no public money going into Argo. Ocean SSTAs are sure looking a lot cooler in general. |
|
|
|
Post by missouriboy on Feb 10, 2017 22:21:46 GMT
North Atlantic Ocean (45-65N) Argo Update
It seems that your humble data guy (me) made a mistake. The reason I couldn't get any Argo updates was because they introduced a new version of the Global Marine Atlas, so, of course, my version would not update. There was no message to that effect, but after all these years I should have known to return to the main site, which I didn't.  So, I must apologize if I implied that Argo was withholding data. They were not. The update for the North Atlantic between 45 and 65 N Latitude shows that mean temperatures in the top 100 meters across the whole basin (shown in the first chart as deviations from 2004) increased during 2016 although they are still -0.5 C below where they were in 2004. Waters at 100 to 700 meters depth remained steady over the last 12 months, while water temperatures below 700 m continued to decline. Water below 1250 m are however 0.2 degrees C higher than in 2004. Across all depths (0-2000 m) water temperature are 0.2 C below where they were in 2014. When viewed by longitude across the basin (graphs 2-5), it is clear that the bulk of the change occurred east of 40 W Longitude. Between 700 and 1250 m, the bulk of the change occurs east of 30 W Longitude. I assume that this represents colder (than 2004) being exported southeastward. 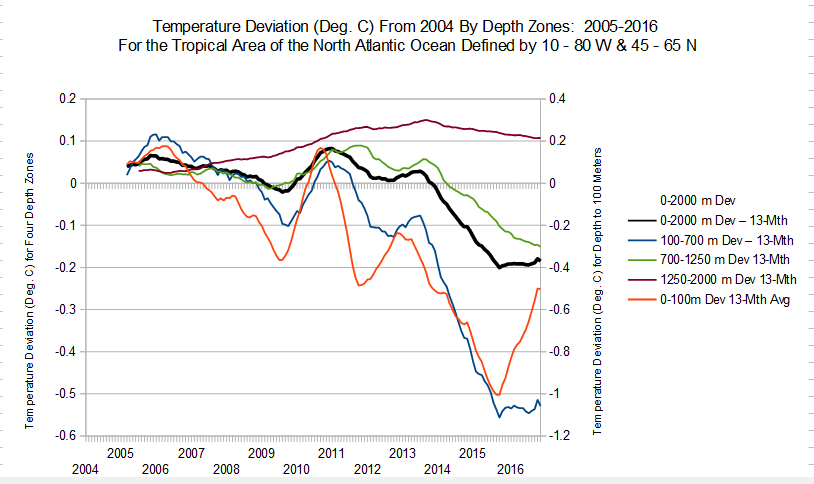 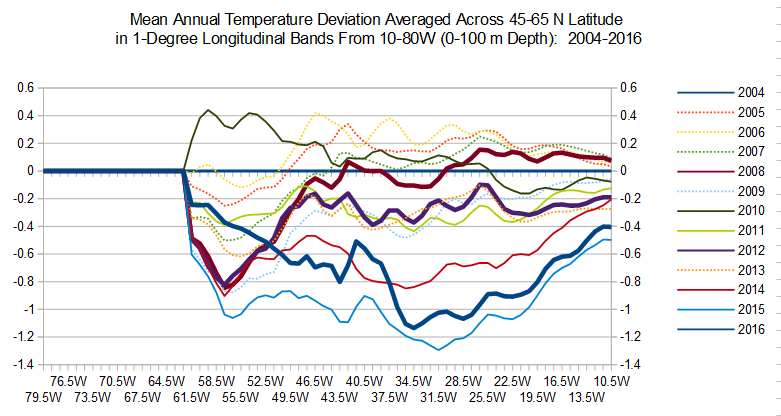 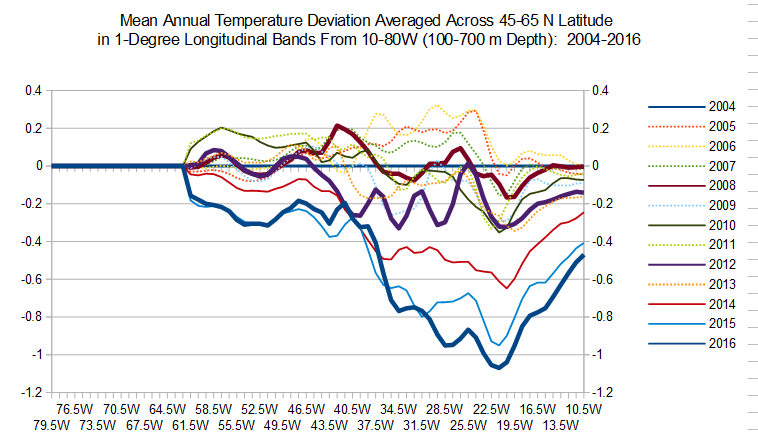 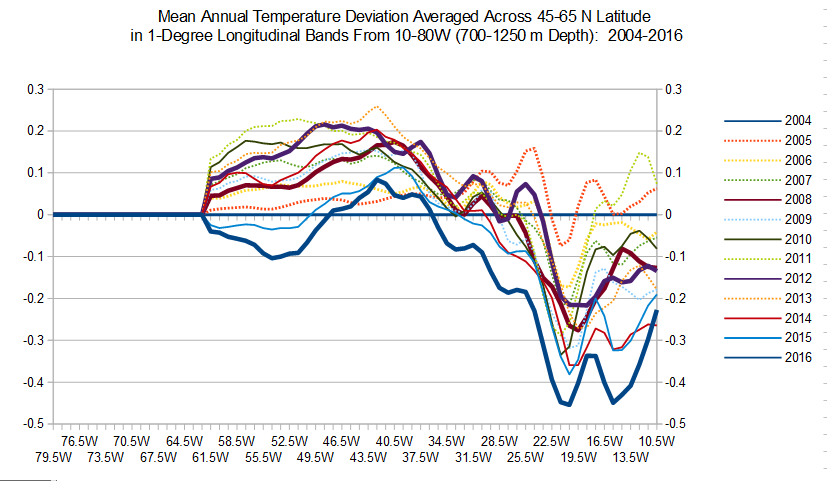 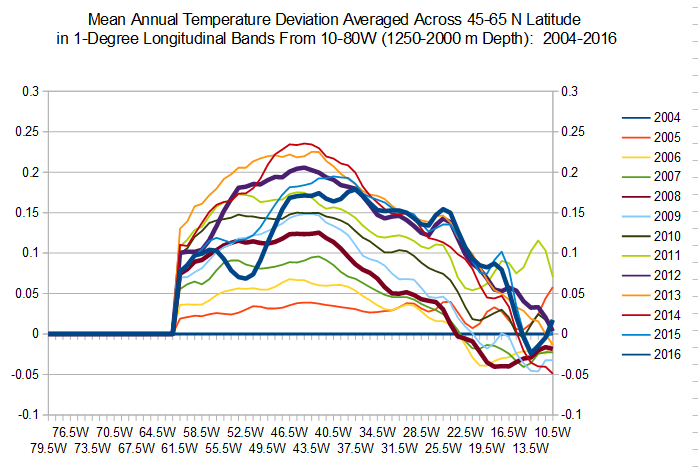
|
|
|
|
Post by missouriboy on Feb 10, 2017 22:45:46 GMT
|
|
|
|
Post by missouriboy on Mar 6, 2017 19:31:19 GMT
WHAT IS DRIVING THE TEMPERATURE CHANGES IN THE NORTH ATLANTIC
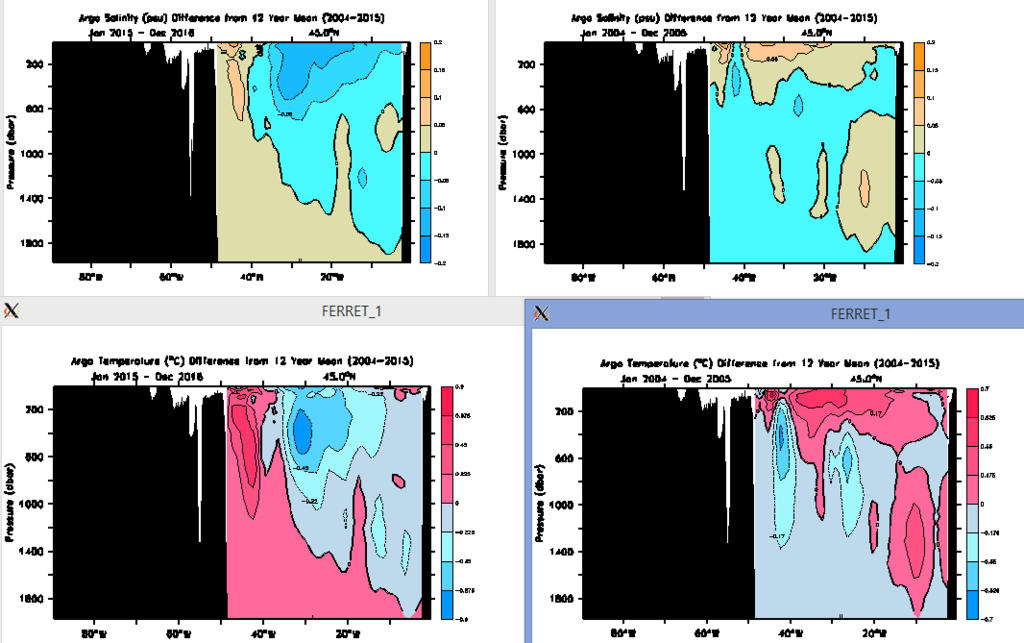
We have speculated in the past on this issue. I don't claim to have the answer, but with additional Argo data I've revisited this topic looking at a combination of temperature and salinity deviations to see if anything stands out. There are many plan views and cross sections below comparing deviations from the 2004-15 normal for the first two years of the series (2004-05) and the last two years of the series (2015-16) for multiple depths (0-100m, 100-700m, 700-1250m and 1250-2000m). This is a summary of what has been stated previously. Please correct me if and where I'm wrong. We seem to have concluded that since 2014 (or thereabouts) the N Atlantic north of about 45 N Latitude has gotten colder (about -0.5 C) at depths above 700 meters or so. These deviations exceed -1 C in select areas. This suggests that less warm water associated with the N Atlantic gyre is going north as part the of the NAD, which breaks from the gyre at about 50 W Longitude. At the same time, organizations measuring these currents have stated that the gyre and the NAD have not slowed down. Has this changed? I've heard nothing about the new instrumentation array from Greenland to Scotland (?) that was supposed to be operational in 2015 (?). Nor do I remember any new measurements of subsidence which is credited with driving much of the NAD. Temperature and salinity deviations from a 12-year annual norm are shown below for 2015-16 (top) and 2004-05 bottom. The observations suggest that warmer waters are being segregated (corraled) into the western portions of the basin above 700 meters depth south of 45 N Latitude. Salinity, which generally increases with water temperature (due to evaporation), sometimes provides a clearer picture of what may be occurring, than temperature deviations alone. We have seen that in cross sections of the NAD that show salinity 'bubbles' sinking off the overturning flank of the current. Colder waters, which are usually associated with colder (fresher) Arctic waters, are generally less saline. At depths of 0-100 meters (chart 1), the 2015-16 period shows colder, fresher waters occupying the northern and eastern part of the basin. If waters associated with the gyre continue circulating eastward (as they supposedly do), then they are being diluted (cooled and freshened) east of about 40 W Longitude. At 100-700 meters (chart 2) it is the same. At 700-1250 meters (chart 3), areas of the gyre (south of 40 N Lat.) still show a continuation of warmer, more saline waters eastward to the Spanish-North African coastlines. At 1250-2000 meters (chart 4) an interesting pattern emerges. The northern edge of the gyre shows a large increase in salinity. Are we seeing a new area of subsidence, where warm, saline sub-tropical waters are being subducted to deeper levels of the water column? Instead of flowing northward with the NAD, are they now going downward at the junction of the gyre-NAD interface? Note the very high salinity deviations concentrated at the general location of the gyre-NAD break at each depth-category level. Also note the 'tongue' of warmer, more saline water that stands out in the combined 700-2000 meter depth chart (chart 5). Chart 6 shows in cross section what are likely current flows of warmer-colder and more saline-less saline flows at 45 N Latitude. CHART 1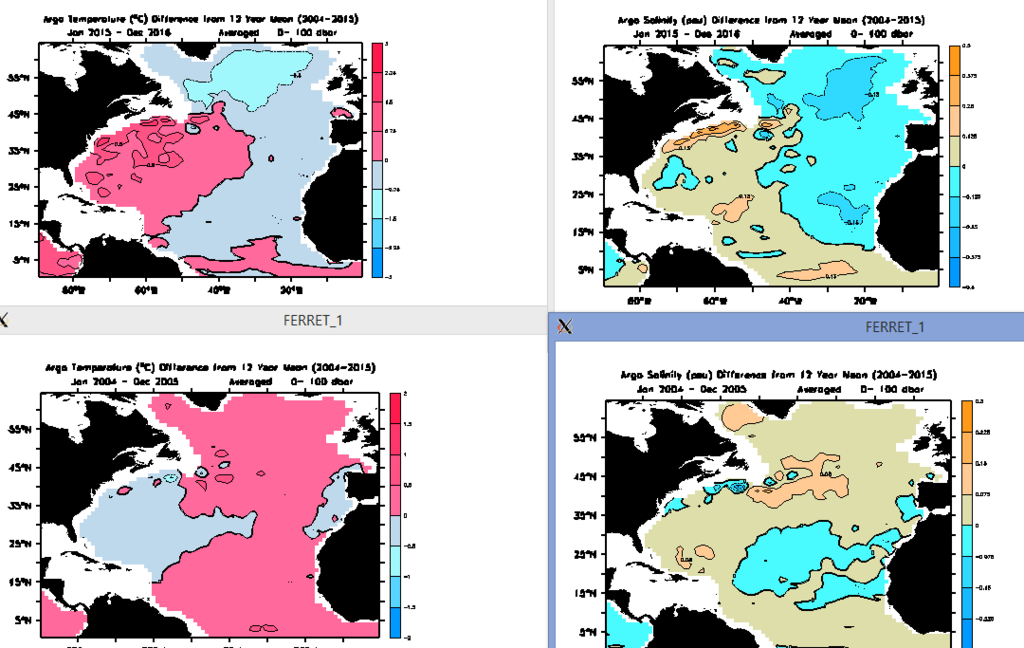 CHART 2 CHART 2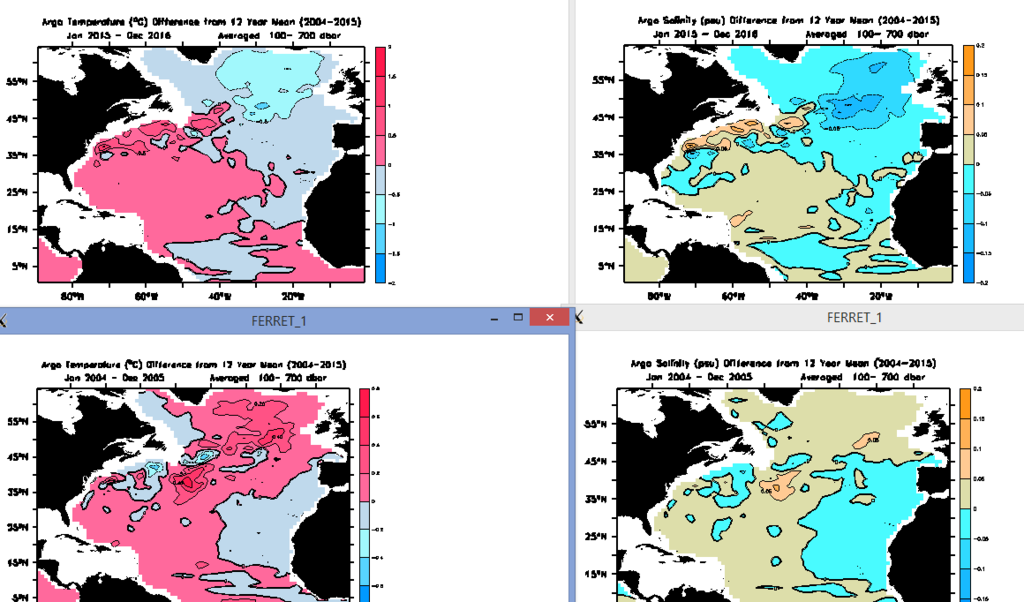 CHART 3 CHART 3
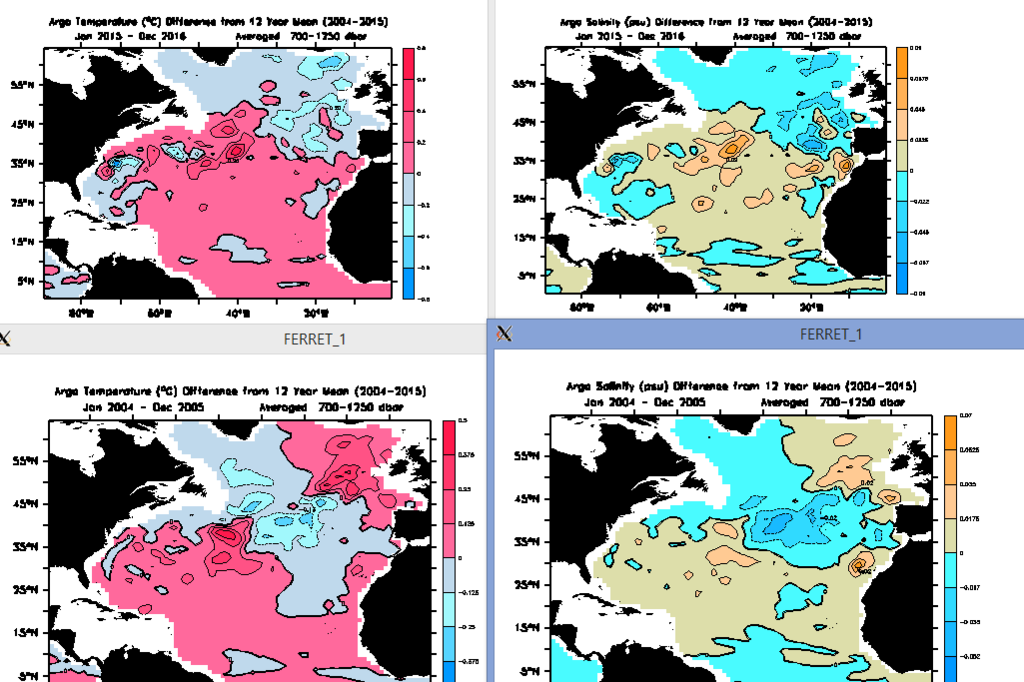 CHART 4 CHART 4
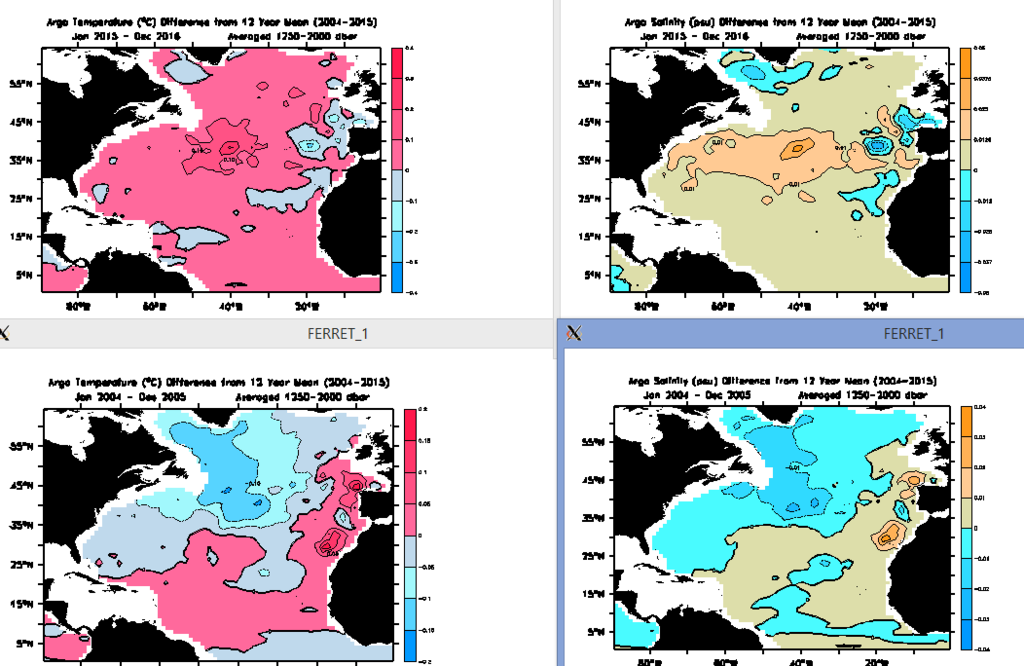 CHART 5 CHART 5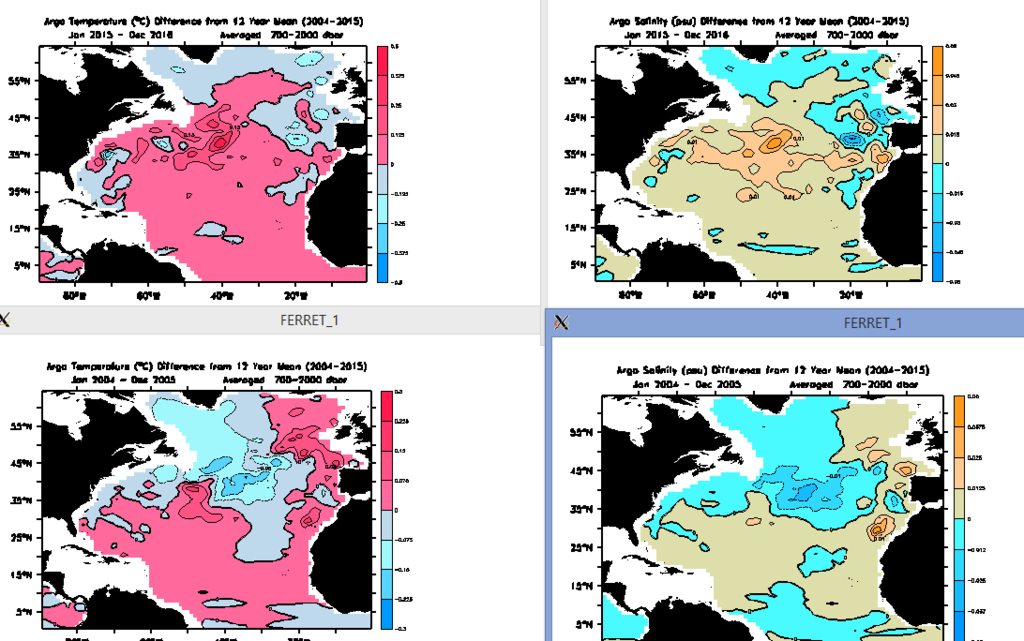 CHART 6 CHART 6
|
|
|
|
Post by missouriboy on Mar 8, 2017 7:28:06 GMT
The AMOC and the AMO
Posted on the OSNAP website (Overturning in the Subpolar North Atlantic Program) www.o-snap.org/the-amoc-and-the-amo/DATA www.o-snap.org/observations/data/Data from the OSNAP moorings, gliders and floats will be made publicly available no later than two years after the data are collected (please refer to the OSNAP data management plan below for more details regarding OSNAP data access). OSNAP data products will match those of the RAPID program, namely, the depth and zonally-integrated mass, heat and freshwater fluxes, but OSNAP data products will also include 1) the horizontal component for heat and freshwater fluxes and 2) the MOC calculation in density coordinates. The OSNAP PIs are committed to a timely delivery of OSNAP products. The earliest expected delivery of the first OSNAP products is one year after the retrieval of the data necessary for the calculations, i.e., late summer of 2017.
|
|
|
|
Post by acidohm on Apr 16, 2017 17:23:59 GMT
youtu.be/U1lEmS7bGvgI'm sure you've seen this Missouriboy...some good points about Greenland melting and recent wind directions. Gonna desalinate quite a bit of the Labrador current don't you think? I'm still really watching for a re-occurance of that cold pool from a couple of years ago. I'm sure the lab current creates an interference just off the coast of the US, but gulf stream has proved more prevalent.. . Osnap data would be welcome over time!!
|
|
|
|
Post by acidohm on May 15, 2017 5:08:52 GMT
Labrador current smashing the gulf stream this spring, huge intensly cold anomaly building off the NE coast usa....
Reckon itll be a cold N Atlantic this summer.
It should be noted this occurs as the arctic ice decline is lower then average, Greenland ice mass is very high.
I dont think ice melt explains this.....
|
|
|
|
Post by missouriboy on May 16, 2017 3:23:01 GMT
Labrador current smashing the gulf stream this spring, huge intensly cold anomaly building off the NE coast usa.... Reckon itll be a cold N Atlantic this summer. It should be noted this occurs as the arctic ice decline is lower then average, Greenland ice mass is very high. I dont think ice melt explains this..... Wow ... what a change in one month's time. Sure looks like it's breaking up the NAD and the gyre's surface flow. Cold water down to 30 N. If solar declines can affect the size and strength of the Hadley cells, then maybe it can affect the mass of water being moved too. But whatever, the cold surface water moving south does appear to be overwhelming the warm surface flow. Maybe this is how an AMO changes. Could atmospheric pressure patterns north of 40N have an effect? earth.nullschool.net/#2017/05/15/0000Z/ocean/surface/currents/overlay=sea_surface_temp_anomaly/orthographic=-47.16,43.61,706/loc=-48.480,42.350 That blue coastal stream reaches all the way to the Cheasapeake. Maybe Trump really is draining the swamp.  |
|
|
|
Post by glennkoks on May 17, 2017 3:05:11 GMT
Labrador current smashing the gulf stream this spring, huge intensly cold anomaly building off the NE coast usa.... Reckon itll be a cold N Atlantic this summer. It should be noted this occurs as the arctic ice decline is lower then average, Greenland ice mass is very high. I dont think ice melt explains this..... Wow ... what a change in one month's time. Sure looks like it's breaking up the NAD and the gyre's surface flow. Cold water down to 30 N. If solar declines can affect the size and strength of the Hadley cells, then maybe it can affect the mass of water being moved too. But whatever, the cold surface water moving south does appear to be overwhelming the warm surface flow. Maybe this is how an AMO changes. Could atmospheric pressure patterns north of 40N have an effect? earth.nullschool.net/#2017/05/15/0000Z/ocean/surface/currents/overlay=sea_surface_temp_anomaly/orthographic=-47.16,43.61,706/loc=-48.480,42.350 That blue coastal stream reaches all the way to the Cheasapeake. Maybe Trump really is draining the swamp.  It's not just the North Atlantic that looks cooler than normal. The South Atlantic does as well. |
|
|
|
Post by acidohm on May 17, 2017 6:05:57 GMT
The cold plume heading down the labrador coast is what has got these huge icebergs in it, apparently the wind has had an unusual NE predominance to it coming down the Baffin straights.... (source adapt 2030)
Perhaps this influence is giving the lab current greater strength?
It just seems to be overpowering the gulf stream rather then being forced to hug the NE usa coast.....
|
|
|
|
Post by missouriboy on Sept 12, 2017 3:05:21 GMT
|
|
|
|
Post by sigurdur on Oct 24, 2017 16:51:05 GMT
|
|
|
|
Post by blustnmtn on Oct 24, 2017 19:23:44 GMT
Besides the usage of a ridiculous movie to highlight his points and the discredited "hockey stick" temperature data, the "blue blob" south of Greenland isn't there right now!  |
|