|
|
Post by duwayne on Apr 11, 2014 17:15:03 GMT
Svensmark's paper drew a lot of criticism and counterattacks from the warmists, some of it reasonably well thought out. I'd be interested to hear whether this paper draws more of the same.
|
|
|
|
Post by cuttydyer on Apr 16, 2014 7:54:05 GMT
A paper published today in Palaeogeography, Palaeoclimatology, Palaeoecology reconstructs Arctic sea ice near West Greenland over the past 5,000 years and finds that solar activity "may be an important contributor to the sea-ice changes."  The paper shows Total Solar Irradiance [TSI] at the end of the 20th century was at the highest levels of the past 5,000 years, and a correspondence between solar activity and Arctic sea ice concentration. Data from the paper shows Arctic sea ice concentrations were similar [or less than] the present during the Medieval & Roman Warm Periods & the late Holocene Climate Optimum, when solar activity was relatively high. The authors find Arctic sea ice was at the highest concentrations during the Little Ice Age [LIA], corresponding to a period of very low solar activity [the LIA is coincidentally when instrumental observations of global temperatures began].  Total Solar Irradiance shown in top graph, LIA = Little Ice Age, MCA = Medieval Climate Anomaly = Medieval Warm Period, DACP = Dark Ages Cold Period, RWP = Roman Warm Period, HTM = Holocene Thermal Maximum Abstract A diatom-based sea-ice concentration (SIC) transfer function was developed by using 72 surface samples from west of Greenland and around Iceland, and validated against associated modern SIC. Canonical correspondence analysis on surface sediment diatoms and monthly average of SIC indicated that April SIC is the most important environmental factor controlling the distribution of diatoms in the area, justifying the development of a diatom-based SIC transfer function. The agreement between reconstructed SIC based on diatoms from West Greenland and the satellite and modelled sea-ice data during the last ~ 75 yr suggests that the diatom-based SIC reconstruction is reliable for studying the palaeoceanography off West Greenland. Relatively warm conditions with a strong influence of the Irminger Current (IC) were indicated for the early part of the record (~ 5000–3860 cal. yr BP), corresponding in time to the latest part of the Holocene Thermal Maximum. Between 3860 and 1510 cal. yr BP, April SIC oscillated around the mean value (55%) and during the time interval 1510–1120 cal. yr BP and after 650 cal. yr BP was above the mean, indicating more extensive sea-ice cover in Disko Bugt. Agreement between reconstructed April SIC and changes in the diatom species suggests that the sea-ice condition in Disko Bugt was strongly influenced by variations in the relative strength of two components of the West Greenland Current, i.e. the cold East Greenland Current and the relatively warm IC. Further analysis of the reconstructed SIC record suggests that solar radiation may be an important forcing mechanism behind the historic sea-ice changes. Link: www.sciencedirect.com/science/article/pii/S0031018214001540Schtick: hockeyschtick.blogspot.co.uk/2014/04/new-paper-finds-solar-activity-may.html |
|
|
|
Post by duwayne on Apr 18, 2014 4:56:28 GMT
This article says "The first official prediction for the peak of Cycle 25 is only seven spots!" Has anyone seen this "official" prediction? The sunspot activity has jumped a lot recently. The SESC sunspot number for April 17 was 296 which would be about 178 on the ISES scale.
|
|
|
|
Post by sigurdur on Apr 18, 2014 12:08:04 GMT
Sunspots are like climate. Hard to predict a few days/years much less a decade.
|
|
|
|
Post by cuttydyer on Apr 23, 2014 6:55:19 GMT
New paper finds solar UV is correlated to global mean temperatureThe Schtick reports: A paper published today in Methods in Ecology and Evolution describes a new satellite dataset of solar UV-B radiation for use in ecological studies. According to the authors, "UV-B surfaces were correlated with global mean temperature and annual mean radiation data, but exhibited variable spatial associations across the globe." The finding is notable, since climate scientists dismiss the role of the Sun in climate change by only looking at the tiny 0.1% variations in total solar irradiance [TSI] over solar cycles, ignoring the large variations in solar UV of up to 100% over solar cycles, and which according to this paper, correlates to global mean temperature. Thus, the role of the Sun and solar amplification mechanisms on climate is only at the earliest stages of understanding.  Michael Beckmann et al Macroecology has prospered in recent years due in part to the wide array of climatic data, such as those provided by the WorldClim and CliMond data sets, which has become available for research. However, important environmental variables have still been missing, including spatial data sets on UV-B radiation, an increasingly recognized driver of ecological processes. We developed a set of global UV-B surfaces (glUV) suitable to match common spatial scales in macroecology. Our data set is based on remotely sensed records from NASA's Ozone Monitoring Instrument (Aura-OMI). Following a similar approach as for the WorldClim and CliMond data sets, we processed daily UV-B measurements acquired over a period of eight years into monthly mean UV-B data and six ecologically meaningful UV-B variables with a 15-arc minute resolution. These bioclimatic variables represent Annual Mean UV-B, UV-B Seasonality, Mean UV-B of Highest Month, Mean UV-B of Lowest Month, Sum of Monthly Mean UV-B during Highest Quarter and Sum of Monthly Mean UV-B during Lowest Quarter. We correlated our data sets with selected variables of existing bioclimatic surfaces for land and with Terra–MODIS Sea Surface Temperature for ocean regions to test for relations to known gradients and patterns. UV-B surfaces showed a distinct seasonal variance at a global scale, while the intensity of UV-B radiation decreased towards higher latitudes and was modified by topographic and climatic heterogeneity. UV-B surfaces were correlated with global mean temperature and annual mean radiation data, but exhibited variable spatial associations across the globe. UV-B surfaces were otherwise widely independent of existing bioclimatic surfaces. Our data set provides new climatological information relevant for macroecological analyses. As UV-B is a known driver of numerous biological patterns and processes, our data set offers the potential to generate a better understanding of these dynamics in macroecology, biogeography, global change research and beyond. The glUV data set containing monthly mean UV-B data and six derived UV-B surfaces is freely available for download at: www.ufz.de/gluv. Paper link: onlinelibrary.wiley.com/doi/10.1111/2041-210X.12168/abstractSchtick link: hockeyschtick.blogspot.co.uk/2014/04/new-paper-finds-solar-uv-is-correlated.html
|
|
|
|
Post by cuttydyer on Apr 27, 2014 6:46:38 GMT
New paper finds solar activity correlated to hydrological cycle in China  A paper published in Geophysical Research Letters finds a "strong" correlation of solar activity to the hydrological cycle in NW China over the past 700 years. According to the authors, "the underlying periodicity in groundwater recharge fluctuations is similar to those of solar induced climate cycle “Suess wiggles” [also known as the DeVries cycle] and appears to be coherent with phases of the climate fluctuations and solar cycles. Matching periodicity of groundwater recharge rates and solar and climate cycles renders a strong impression that solar induced climate signals may act as a critical amplifier for driving the underlying hydrographic cycle through the common coupling of long-term Sun-climate groundwater linkages." The authors find "a stationary harmonic cycle at ~200?±?20?years" corresponding to the DeVries cycle, also known as "Suess Wiggles."  Imprint of long-term solar signal in groundwater recharge fluctuation rates from North West China R.K. Tiwari, and Rekapalli Rajesh Multiple spectral and statistical analyses of a 700-year long temporal record of groundwater recharge from the dry lands, Badain Jaran Desert (Inner Mongolia) of North West China reveal a stationary harmonic cycle at ~200?±?20?year. Interestingly, the underlying periodicity in groundwater recharge fluctuations is similar to those of solar induced climate cycle “Suess wiggles” and appears to be coherent with phases of the climate fluctuations and solar cycles. Matching periodicity of groundwater recharge rates and solar and climate cycles renders a strong impression that solar induced climate signals may act as a critical amplifier for driving the underlying hydrographic cycle through the common coupling of long-term Sun-climate groundwater linkages. Paper link: onlinelibrary.wiley.com/doi/10.1002/2014GL060204/abstractSchtick link: hockeyschtick.blogspot.co.uk/2014/04/new-paper-finds-solar-activity_24.html |
|
|
|
Post by sigurdur on Apr 27, 2014 18:56:28 GMT
Cutty:
Keep these coming. Being it worked over there, I am going to have to look at my regional climate and see if there is also a response.
|
|
|
|
Post by cuttydyer on May 1, 2014 13:37:09 GMT
New paper finds solar activity related to the polar vortex & jet stream variability:  A paper published in the Journal of Geophysical Research Atmospheres finds a link between solar cycles, the natural quasi-biennial oscillation [QBO], and the late winter polar vortex. The authors use ozone as a marker of "modulations of the winter Arctic stratosphere by the quasi-biennial oscillation (QBO) and the solar cycle. It is found that both the QBO and solar forcing in low latitudes can perturb the late winter polar vortex, likely via planetary wave divergence, causing an early breakdown of the vortex in the form of Stratospheric Sudden Warming [SSW]." The QBO and Sudden Stratospheric Warmings have in turn been linked to solar activity, suggesting that the Sun could be the ultimate source of polar vortex/jet stream blocking variability. Jet stream dips of the polar vortex were responsible for the record-breaking cold US winter this year, which warmist Jennifer Francis desperately tries to blame on man, but this paper and many others suggest the jet stream dips were instead related to natural & solar variability. Paper link: onlinelibrary.wiley.com/doi/10.1002/2013JD021065/abstractSchtick link: hockeyschtick.blogspot.co.uk/2014/04/new-paper-finds-solar-activity-related.html |
|
|
|
Post by sigurdur on May 1, 2014 15:08:21 GMT
What I am finding amazing is that during the "pause" in warming, actual science is starting to emerge.
ABOUT DAMN TIME!
|
|
|
|
Post by cuttydyer on May 6, 2014 8:41:04 GMT
New paper finds solar activity correlated to rainfall over past 6,000 years.  A paper published today in Quaternary Science Reviews finds precipitation in Australia was correlated to solar activity over the past 6,000 years. According to the paper, an "abrupt increase in rainfall 2,800 years ago coincides with a grand solar minimum" and "Increased rainfall in response to a solar minimum is consistent with climate model simulations." The paper also shows also shows solar activity in the 20th century was at some of the highest levels of the past 6,000 years.  The paper adds to many others finding solar activity drives the hydrological cycle, another solar amplification mechanism by which tiny changes in solar activity are amplified to large scale effects on climate. Link: www.sciencedirect.com/science/article/pii/S027737911400122XSchtick link: hockeyschtick.blogspot.co.uk/2014/05/new-paper-finds-solar-activity.html |
|
|
|
Post by sigurdur on May 6, 2014 12:56:15 GMT
The wonderful thing about the pause, is that scientists are looking for actual climate drivers. We all knows CO2 is a greenhouse gas, but it isn't the baseball bat in Roger Maris's hands.
|
|
|
|
Post by kenfeldman on May 8, 2014 4:22:55 GMT
The wonderful thing about the pause, is that scientists are looking for actual climate drivers. We all knows CO2 is a greenhouse gas, but it isn't the baseball bat in Roger Maris's hands. Well, there has been progress in measuring the factors that effect climate. What has become clear is that volcanic eruptions have more impact on the climate than changes in the solar forcing. However, CO2 is still the biggy over the past 50 years. Link to the full article here. |
|
|
|
Post by kenfeldman on May 8, 2014 4:25:03 GMT
Here's an image that shows the relative importance of climate forcings. CO2 is still number one. Maybe not Maris, but Aaron  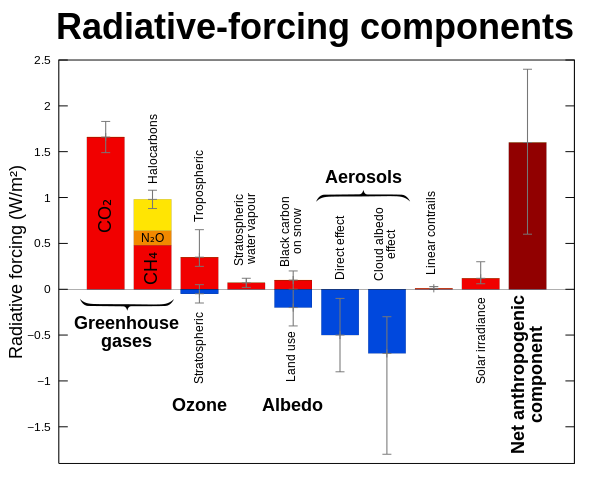 |
|
|
|
Post by cuttydyer on May 8, 2014 7:19:48 GMT
Here's an image that shows the relative importance of climate forcings. CO2 is still number one. You've inferred that CO2 is the primary player in climate forcings, so looking at the Antarctic trend below exactly which periods would you say were as a result of CO2 forcing and which periods were as a result of solar forcing?  Graph courtesy of BBC: static.dyp.im/l0SSk9pEYO/large/84886de3176413f0121815d607c39293.jpg |
|
|
|
Post by douglavers on May 8, 2014 7:41:13 GMT
What happened to old-fashioned water vapour?
Also, I think that CO2 concentrations have varied wildly in the past, well before SUVs were invented.
|
|


