|
|
Post by missouriboy on Nov 13, 2017 15:08:04 GMT
Link from Jennifer Marohasy's site to the Rhodes Fairbridge paper is broken, here is a working link to the PDF (suggest people save the content as people may be doing a clean up  ) faculty.fgcu.edu/twimberley/EnviroPol/EnviroPhilo/Fairbridge.pdfDespite starting almost as a biography, the paper gives a very good grounding in the idea of inertial motion in the Sun affecting solar output and thus changing the Earth's climate as the Earth's systems react to the changes in radiation and geomagnetic effects. It also has a very good list of references for those that have time and inclination to dig deeper. Even rats occasionally clean their nests of objectionable items. Thank you Naut. That is a marvelous document. |
|
|
|
Post by missouriboy on Nov 16, 2017 14:16:49 GMT
A Little Something for the UV & Geomagnetic Crowd
ntrs.nasa.gov/archive/nasa/casi.ntrs.nasa.gov/19650019859.pdfDaily values of atmospheric temperature have been compared EUV radiation data and also with indices of geomagnetic activity. The analysis which includes both a phase and amplitude study favors the EUV rather than the solar wind effect as principally responsible for the 27-day variations in atmospheric temperature at least for the months of March and April 1962. The question as to whether this conclusion applies at all times and whether a second source of heating is required to explain semi-annual and diurnal temperature variations remains open. And others ... onlinelibrary.wiley.com/doi/10.1029/TE051i001p00001/abstractSOLAR EUV IRRADIANCE www.swpc.noaa.gov/phenomena/solar-euv-irradianceSolar Extreme Ultraviolet (EUV) is solar radiation that covers the wavelengths 10 – 120 nm of the electromagnetic spectrum. It is highly energetic and it is absorbed in the upper atmosphere, which not only heats the upper atmosphere but also ionizes it, creating the ionosphere. Solar EUV radiation changes by a factor of ten over the course of a typical solar cycle. This variability produces similar variations in the ionosphere and upper atmosphere. Solar EUV variations are one of the three primary drivers of ionospheric variability. Solar Extreme-Ultraviolet (EUV) radiation originates in the corona and chromosphere of the Sun’s atmosphere. The solar EUV spectrum, between 1 and 120 nm, is dominated by spectral lines from hydrogen (H), helium (He), oxygen (O), sodium (Na), magnesium (Mg), silicon (Si), and iron (Fe). The EUV photons reach Earth and are completely absorbed in the upper atmosphere above 80 km. The thermosphere of the earth, 80 to 600 km in altitude, is heated predominantly by solar EUV radiation. The EUV photons also ionize the atmosphere creating electrons, which form the ionosphere. Solar EUV irradiance varies by as much as an order of magnitude on time scales of minutes to hours (solar flares), days to months (solar rotation), and years to decades (solar cycle). The highly varying EUV radiation causes the thermosphere and ionosphere to vary over similar magnitudes and time scales. Because solar EUV radiation is absorbed by the upper atmosphere it is impossible to measure from the ground. Thus, measurements must be made from rockets and satellites. It is difficult to build and maintain sensors that can measure the solar EUV radiation so for many years people relied on proxies for solar EUV such as the Sunspot Number or the F10.7 cm radio flux. 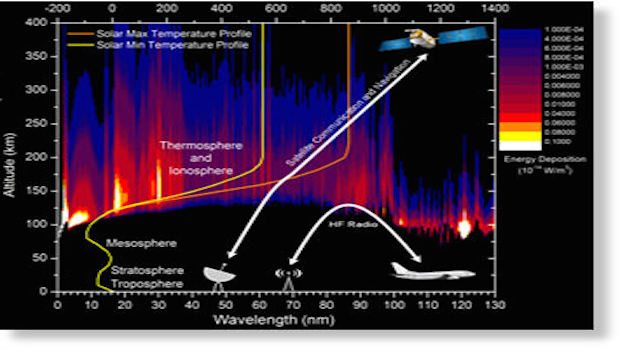 link.springer.com/article/10.1023/A%3A1021812210921 link.springer.com/article/10.1023/A%3A1021812210921 Very good references. Comparison of Solar and Geomagnetic Activity Effects on the Northern Hemisphere Weather Changes Abstract The changes of pressure and temperature fields in the winter lower troposphere observed in association with changes in solar and/or geomagnetic activity are compared. It is shown that the fact whether it was solar or geomagnetic activity was not so important as whether the levels of the two activities were high or low. The differences between the effects of solar/geomagnetic activity, however, are revealed, the pressure and temperature data being stratified according to the QBO phase. The relationship obtained are discussed from the viewpoint of mechanisms resting upon both the planetary wave propagation and the changes of atmospheric air currents in the global electric circuit.
|
|
|
|
Post by hrizzo on Dec 3, 2017 10:37:46 GMT
Nature Unbound VI – Centennial to millennial solar cycles judithcurry.com/2017/12/02/nature-unbound-vi-centennial-to-millennial-solar-cycles/Holocene climate has been affected in different periods by several centennial to millennial solar cycles. The ~ 1000-year Eddy solar cycle seems to have dominated Holocene climate variability between 11,500-4,000 years BP, and in the last two millennia, where it defines the Roman, Medieval, and Modern warm periods. The ~ 208-year de Vries solar cycle displays strong modulation by the ~ 2400-year Bray solar cycle, both in its cosmogenic isotope signature and in its climatic effects. The Centennial, and Pentadecadal solar cycles are observable in the last 400-year sunspot record, and they are responsible for the present extended solar minimum that started in 2008.… Conclusions:1) The ~ 1000-year Eddy solar cycle seems to have dominated Holocene climate variability between 11,500-4,000 years BP and in the last two millennia, where it defines the Roman, Medieval, and Modern warm periods. 2) The ~ 208-year de Vries solar cycle displays strong modulation by the ~ 2400-year Bray solar cycle, both in its cosmogenic isotope signature and in its climatic effects. 3) The ~ 88-year Gleissberg solar cycle is ill-defined in the literature and hasn’t manifested itself for the past 3,500 years. 4) Besides the ~ 11-year Schwabe solar cycle, the Centennial (Feynman), and Pentadecadal solar cycles are observable in the sunspot record. The ~ 100-year Feynman solar cycle is responsible for the present extended solar minimum. 5) In all cases a decadal or longer decrease in solar activity is associated with a decrease in temperatures and a change in precipitation patterns. A 10-year delay between solar changes and climatic changes is observed in some studies. |
|
|
|
Post by acidohm on Dec 6, 2017 22:47:55 GMT
Months below the 1971-2000 average since January 2001 (courtesy of Kevin Bradshaw)
Nov 2017: 6.8 (-0.1)
Sep 2017: 13.5 (-0.2)
Aug 2017: 15.6 (-0.4)
Jan 2017: 4.0 (-0.2)
Nov 2016: 5.6 (-1.3)
Apr 2016: 7.5 (-0.6)
Mar 2016: 5.8 (-0.5)
Sep 2015: 12.6 (-1.0)
Aug 2015: 15.9 (-0.3)
Jul 2015: 15.9 (-0.6)
Jun 2015: 14.0 (-0.1)
May 2015: 10.8 (-0.5)
Feb 2015: 4.0 (-0.2)
Aug 2014: 14.9 (-1.3)
Nov 2013: 6.2 (-0.7)
Jun 2013: 13.6 (-0.5)
May 2013: 10.4 (-0.9)
Apr 2013: 7.5 (-0.6)
Mar 2013: 2.7 (-3.6)
Feb 2013: 3.2 (-1.0)
Jan 2013: 3.5 (-0.7)
Dec 2012: 4.8 (-0.3)
Nov 2012: 6.8 (-0.1)
Oct 2012: 9.7 (-0.7)
Sep 2012: 13.0 (-0.6)
Jul 2012: 15.5 (-1.0)
Jun 2012: 13.5 (-0.6)
Apr 2012: 7.2 (-0.9)
Feb 2012: 3.8 (-0.4)
Aug 2011: 15.4 (-0.8)
July 2011: 15.2 (-1.3)
June 2011: 13.8 (-0.3)
Jan 2011: 3.7 (-0.5)
Dec 2010: -0.7 (-5.8)
Nov 2010: 5.2 (-1.7)
Oct 2010: 10.3 (-0.1)
Aug 2010: 15.3 (-0.9)
May 2010: 10.7 (-0.6)
Mar 2010: 6.1 (-0.2)
Feb 2010: 2.8 (-1.4)
Jan 2010: 1.4 (-2.8)
Dec 2009: 3.1 (-2.0)
Jul 2009: 16.1 (-0.4)
Feb 2009: 4.1 [-0.1]
Jan 2009: 3.0 [-1.2]
Dec 2008: 3.5 (-1.6)
Oct 2008: 9.7 (-0.7)
Sep 2008: 13.5 (-0.2)
Jul 2008: 16.2 (-0.3)
Jun 2008: 13.9 (-0.2)
Apr 2008: 7.9 (-0.2)
Mar 2008: 6.1 (-0.2)
Dec 2007: 4.9 (-0.2)
Aug 2007: 15.4 (-0.8)
July 2007: 15.2 (-1.3)
Aug 2006: 16.1 (-0.1)
Mar 2006: 4.9 (-1.4)
Feb 2006: 3.7 (-0.5)
Dec 2005: 4.4 (-0.7)
Nov 2005: 6.2 (-0.7)
July 2004: 15.8 (-0.7)
Dec 2003: 4.8 (-0.3)
Oct 2003: 9.2 (-1.2)
Feb 2003: 3.9 (-0.3)
Oct 2002: 10.1 (-0.3)
Jul 2002: 16.0 (-0.5)
Dec 2001: 3.6 (-1.5)
Sep 2001: 13.4 (-0.3)
Apr 2001: 7.7 (-0.4)
Mar 2001: 5.2 (-1.1)
Jan 2001: 3.2 (-1.0)
Can anyone see the sun's influence in this complete list of lower then average months in CET???
|
|
|
|
Post by missouriboy on Jan 4, 2018 4:00:58 GMT
watchers.news/2017/12/20/solar-activity-cycle-falls-to-the-bottom-1-5-years-earlier-than-expected/Solar activity cycle falls to the bottom 1.5 years earlier than expected
Posted by TW on December 20, 2017 in categories Featured articles, Space weather Solar activity cycle falls to the bottom 1.5 years earlier than expected According to the Laboratory for X-ray Solar Astronomy of the PN Lebedev Physical Institute in Russia, the solar activity cycle has, by all indications, practically reached its minimum 1.5 years ahead of expected time. Given that the previous solar maximum in 2012 was one of the weakest in the last century, it is possible, that we are now waiting for an earlier and substantially more "severe" minimum of the cycle. There were no magnetic storms and field disturbances observed in the last two months related to solar activity, the laboratory said in a news release. Thus, space weather in the vicinity of our planet is increasingly losing its connection with the Sun, which by all indications practically fell to the bottom of the next minimum of the 11-year solar cycle 1.5 years earlier than expected. At 5.7, the average monthly number of sunspots (one of the main indicators of the level of solar activity) reached a minimum value for the last 8 years of observations in November 2017. The last time the lower value was recorded in the last decade was in August 2009. Although the decrease in the number of sunspots on the Sun is normal for our star, in this case, it occurs unexpectedly early, the laboratory wrote in an earlier release."Up to the minimum point of the solar cycle, there are still about 18 months, and usually at this stage, the sunspot activity of the Sun is higher." The average number of sunspots in September was 43, it dropped to 13 in October and to 5 in November. "It is possible that this indicates a faster approximation of the next solar minimum than was expected. Such cases, when intervals between solar minima were reduced from 11 to 10 and even 9 years, are known in the history of astronomy, but occurred quite a long time ago - about 200 years - called the Dalton minimum. 400 years of sunspot observations "Given that the previous solar maximum in 2012 was one of the weakest in the last century, it is possible, that we are now waiting for an earlier and substantially more "severe" minimum of the cycle. "If so, it is impossible to exclude that solar activity is now falling to the bottom of a 100-year or even 1000-year cycle. Although the question of the presence of such global recessions in the Sun is still debatable, radiocarbon analysis of rocks and plants provides much evidence of the existence of such changes in the past."
|
|
|
|
Post by acidohm on Jan 4, 2018 6:02:06 GMT
It's very worrying that this year has a 100% spotless record....i mean, when was the last time THAT happened?? 😉
|
|
|
|
Post by nautonnier on Jan 4, 2018 10:27:39 GMT
""Given that the previous solar maximum in 2012 was one of the weakest in the last century, it is possible, that we are now waiting for an earlier and substantially more "severe" minimum of the cycle. "
I believe that this misses the point. SC24 could still be a long solar cycle - it may be that we remain at 'spotless' for another 24 months or more until some indication that SC25 is starting.
Apart from the potential weather/climate impacts it would be entertaining watching the solar physicists cycling through different excuses explanations. I note that most reports go back and try to equate SC24 to a previous cycles and then from that predict that the next cycle will follow an analogous pattern. This may be an assumption too far expecting a chaotic system to repeat precisely.
Theo is starting to see support from observations.
|
|
|
|
Post by Ratty on Jan 4, 2018 12:45:53 GMT
""Given that the previous solar maximum in 2012 was one of the weakest in the last century, it is possible, that we are now waiting for an earlier and substantially more "severe" minimum of the cycle. "I believe that this misses the point. SC24 could still be a long solar cycle - it may be that we remain at 'spotless' for another 24 months or more until some indication that SC25 is starting. Apart from the potential weather/climate impacts it would be entertaining watching the solar physicists cycling through different excuses explanations. I note that most reports go back and try to equate SC24 to a previous cycles and then from that predict that the next cycle will follow an analogous pattern. This may be an assumption too far expecting a chaotic system to repeat precisely. Theo is starting to see support from observations. Do you have a Theo update, Naut? |
|
|
|
Post by nautonnier on Jan 4, 2018 14:15:48 GMT
""Given that the previous solar maximum in 2012 was one of the weakest in the last century, it is possible, that we are now waiting for an earlier and substantially more "severe" minimum of the cycle. "I believe that this misses the point. SC24 could still be a long solar cycle - it may be that we remain at 'spotless' for another 24 months or more until some indication that SC25 is starting. Apart from the potential weather/climate impacts it would be entertaining watching the solar physicists cycling through different excuses explanations. I note that most reports go back and try to equate SC24 to a previous cycles and then from that predict that the next cycle will follow an analogous pattern. This may be an assumption too far expecting a chaotic system to repeat precisely. Theo is starting to see support from observations. Do you have a Theo update, Naut? No - but we had a relatively hard frost for this area around -2C and just 50 miles North they had snow not very common in Florida. It looks like cold is expected back in NW Europe. If this were to continue into Feb with the Sun maintaining its blank stare - people may start getting edgy and as Theo said start to believe that perhaps things were getting colder. |
|
|
|
Post by blustnmtn on Jan 4, 2018 14:42:05 GMT
Do you have a Theo update, Naut? No - but we had a relatively hard frost for this area around -2C and just 50 miles North they had snow not very common in Florida. It looks like cold is expected back in NW Europe. If this were to continue into Feb with the Sun maintaining its blank stare - people may start getting edgy and as Theo said start to believe that perhaps things were getting colder. I think Graywolf will holdout for a bit longer. |
|
|
|
Post by acidohm on Jan 4, 2018 17:13:07 GMT
No - but we had a relatively hard frost for this area around -2C and just 50 miles North they had snow not very common in Florida. It looks like cold is expected back in NW Europe. If this were to continue into Feb with the Sun maintaining its blank stare - people may start getting edgy and as Theo said start to believe that perhaps things were getting colder. I think Graywolf will holdout for a bit longer. Hope he does!! |
|
|
|
Post by nonentropic on Jan 4, 2018 19:36:36 GMT
Naut the understanding I have is that inactive solar cycles are likely also to be long.
In fact David cant remember his name used cycle length in his studies. My concern is that the NASA's etc are talking short cycle for this one but it may be a very extended low period with some muted bumps and hops.
Astro would be a help for this discussion and he may be able to lift our understanding of the mechanisms he is using.
|
|
|
|
Post by nautonnier on Jan 4, 2018 19:41:28 GMT
Naut the understanding I have is that inactive solar cycles are likely also to be long. In fact David cant remember his name used cycle length in his studies. My concern is that the NASA's etc are talking short cycle for this one but it may be a very extended low period with some muted bumps and hops. Astro would be a help for this discussion and he may be able to lift our understanding of the mechanisms he is using. Hi Nonentropic, I agree that the SC24 length may well be long - that is my concern as I said a 2 year blank stare from the Sun will percolate through to the most inattentive. If that also links to drops in temperature, then the climate 'scientists' will be starting to talk fast and be concerned about their research funding. It would be good to have an input from Theo - but we are watching the observations vs hypothesis and so far no falsification. |
|
|
|
Post by RicksFormula on Jan 4, 2018 20:23:13 GMT
SC23 lasted 12 years, 6 months and had a prolonged quiet period of 3+ years at it's end, so early spotless days in this cycle
could just be the start of another extended quiet phase.
|
|
|
|
Post by Ratty on Jan 4, 2018 23:01:40 GMT
Naut the understanding I have is that inactive solar cycles are likely also to be long. In fact David cant remember his name used cycle length in his studies. My concern is that the NASA's etc are talking short cycle for this one but it may be a very extended low period with some muted bumps and hops. Astro would be a help for this discussion and he may be able to lift our understanding of the mechanisms he is using. Archibald? Archibald uses solar and surface data to predict 4.9°C fall (!) |
|


 )
)


