|
|
Post by Ratty on Feb 14, 2015 22:22:56 GMT
Now that I am older. Winter is a great time of the year for a drought! Guess you're referring to Antarctica ......  |
|
|
|
Post by sigurdur on Feb 15, 2015 4:48:08 GMT
Now that I am older. Winter is a great time of the year for a drought! Guess you're referring to Antarctica ...... Ok.......I will admit that it has turned a tad bit on the chilly side for this time of year........Even in ND! |
|
|
|
Post by graywolf on Feb 15, 2015 16:57:38 GMT
Seeing as globally jan posted second warmest on record ( behind the crazy high of jan 2002) you might be being a tad 'local' in your observations siggy? Loads better across the UK this Feb compared to last!
|
|
|
|
Post by sigurdur on Feb 15, 2015 17:54:10 GMT
Seeing as globally jan posted second warmest on record ( behind the crazy high of jan 2002) you might be being a tad 'local' in your observations siggy? Loads better across the UK this Feb compared to last! I agree, hence why I put ND in the comment. |
|
|
|
Post by magellan on Feb 15, 2015 18:40:33 GMT
Seeing as globally jan posted second warmest on record ( behind the crazy high of jan 2002) you might be being a tad 'local' in your observations siggy? Loads better across the UK this Feb compared to last! I agree, hence why I put ND in the comment. RSS places January 2015 as #7 and UAH at #5. January 2012 was #29 and #25 respectively. What is your point? The surface data you people love so much has been contaminated and manipulated beyond recognition from the original records (cooling the past and warming the present), the keepers of the Holy data can't even keep their own lies straight as to why they adjust them in the first place. How's the Arctic death spiral coming along? I see PIOMAS mysteriously reversed their Arctic ice volume data just as predicted, because it was garbage. Based on their trend prior to 2013, it should have ice free this year. |
|
|
|
Post by sigurdur on Feb 15, 2015 19:30:43 GMT
Magellan: Can't use RSS or UAH because the temps they project must be in error. The hot spot isn't showing up, as the models based on CO2 radiation predicted, so the sensors on the satellites must have gone goofy.    |
|
|
|
Post by magellan on Feb 15, 2015 20:49:28 GMT
Magellan: Can't use RSS or UAH because the temps they project must be in error. The hot spot isn't showing up, as the models based on CO2 radiation predicted, so the sensors on the satellites must have gone goofy. Oh the hot spot.....that's so.....1998; thanks for the reminder. I don't understand why skeptics don't just keep pounding these two fundamental problems: 1) Why is the surface warming faster than the atmosphere above (opposite the "greenhouse" effect"). 2) Why is there no tropical tropospheric hotspot as predicted? I was reading a very long thread at Judith Curry's blog. It's just simply mind boggling how convoluted Steve Mosher & The Gang are trying to convince thinking people they aren't fiddling with the data and there is no UHI effect. Just wow. |
|
|
|
Post by icefisher on Feb 16, 2015 4:24:14 GMT
Magellan: Can't use RSS or UAH because the temps they project must be in error. The hot spot isn't showing up, as the models based on CO2 radiation predicted, so the sensors on the satellites must have gone goofy. But the satellites are measuring the hot spot. Its not showing up as a hot spot purely because its warming slower than the "adjusted surface record". One has to consider the possibility that The hot spot is what it is and that the "adjusted surface record" has been overly adjusted to better fit the models thus eliminating the expected more rapid warming of the hotspot than the surface. Remember the hotspot is expected no matter the source of warming. And thus a cooler satellite measurement is what one would then expect when cooling was occurring. I haven't rerun my trend charts for a while but they are not too far out of date. 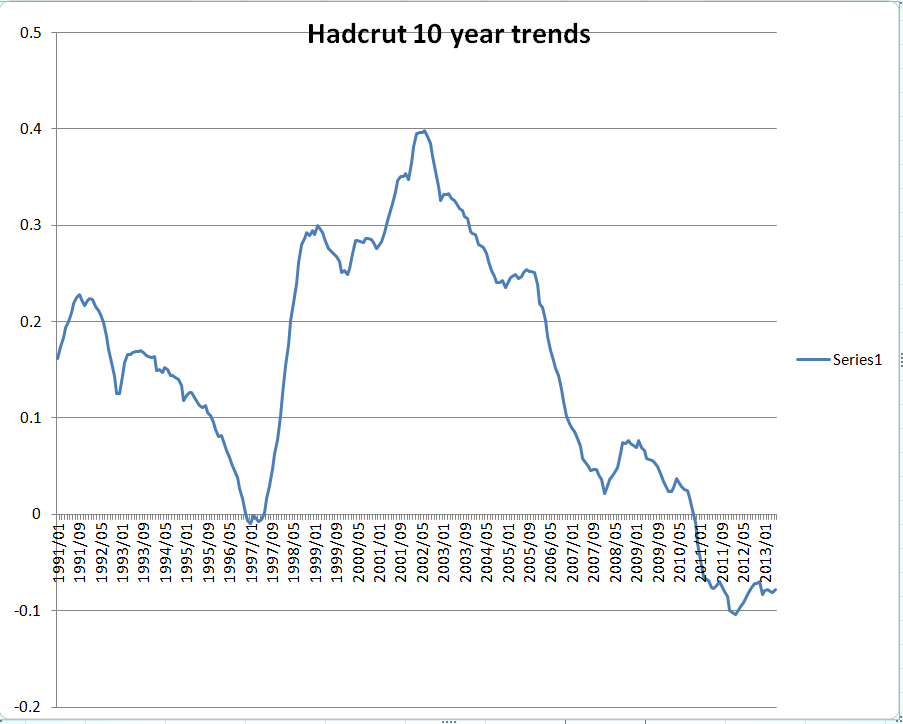 |
|
|
|
Post by nautonnier on Feb 16, 2015 10:22:03 GMT
Yes it is here - in the Atlantic South East - (bottom right ) Cherry blossom out and beds of flowering antirrhinums when I drove through Orlando at the weekend. Still really chilly though barely made 65F yesterday.  |
|
|
|
Post by magellan on Feb 19, 2015 4:45:33 GMT
Magellan: Can't use RSS or UAH because the temps they project must be in error. The hot spot isn't showing up, as the models based on CO2 radiation predicted, so the sensors on the satellites must have gone goofy. But the satellites are measuring the hot spot. Its not showing up as a hot spot purely because its warming slower than the "adjusted surface record". One has to consider the possibility that The hot spot is what it is and that the "adjusted surface record" has been overly adjusted to better fit the models thus eliminating the expected more rapid warming of the hotspot than the surface. Remember the hotspot is expected no matter the source of warming. And thus a cooler satellite measurement is what one would then expect when cooling was occurring. I haven't rerun my trend charts for a while but they are not too far out of date. Well then, the AGW hypothesis of the "greenhouse effect" is falsified if the SAT is correct. They can't have it both ways. I haven't pulled the data in a long time because watching it not move for 5 years was getting boring, kind of like the definition of insanity. As for Winter being done, I am pretty certain February 2015 will be one of if not the coldest February in my lifetime. It was -22F Sunday evening at 11:30 PM according to the furnace outside thermocouple. Thursday night is forecast to be -22F in the thumb (Michigan), but it's usually 2-5 degrees colder where we live. The entire month so far has been absolutely miserable. The first 40 degF day we have I'll be celebrating. I'm going to log the temps tomorrow. We keep the inside temp constant, and I know exactly how much energy is used to heat the house from month to month so can compare to the previous years with this geothermal system. It has 3 stages; 1, 2 and the 3rd is the auxiliary heater for when the heat pump can't keep up. It's come on more this month than since we've had it installed. |
|
|
|
Post by graywolf on Feb 19, 2015 11:59:18 GMT
PDO for Jan is in; margaret.atmos.washington.edu/pdo/PDO.latesthighest Jan figure in the record? the sst's do not seem to want a return to negative anytime soon? With the triple R still very much there (ridiculously resilient ridge) then the waters below it will continue to be warmed..... with China reducing pollution levels then maybe those waters are not getting such a 'dilute' dose of incoming Solar these days? |
|
|
|
Post by sigurdur on Feb 19, 2015 14:40:36 GMT
PDO for Jan is in; margaret.atmos.washington.edu/pdo/PDO.latesthighest Jan figure in the record? the sst's do not seem to want a return to negative anytime soon? With the triple R still very much there (ridiculously resilient ridge) then the waters below it will continue to be warmed..... with China reducing pollution levels then maybe those waters are not getting such a 'dilute' dose of incoming Solar these days? Graywolf: You are starting to understand how SST's temps are influenced. Now to the next bit of information. The RRR, or warm SST's near Alaska are NOT a new happening. The same thing happened in the 1940's, as Big Joe B has happily shown over and over and over. What we now have is a repeat of conditions 60-70 years ago. So, were the skies clearer 60-70 years ago than present? I have no idea as there is no data. Do we know the atmosphere has been on a trend of clarity since 1996? Yes, via actual measurements. Another question. Do we know variations in cloud formation and travel during the last observed RRR/SST correlation? No, we don't. So, in summary, being we haven't a clue what was happening aloft the last time this happened, what does this tell us about this time it is happening? Not a whole lot......just not a whole lot. |
|
|
|
Post by graywolf on Feb 20, 2015 11:16:14 GMT
Sure there are past instances of the triple r but were they during times of vastly reduced sea ice cover/land snow pack cover? Nope they were not. So should we be mindful of this 'novel forcing'? Well the sst for jan's PDO measure seems to offer some clues does it not?
Over the past 20yrs we have studied the impacts of 'soot' on cloud formation noting that the 'un natural' particulates from human pollution lead to condensation nuclei much smaller than those produced in nature ( sea salt wildfire soot etc) and so the droplets in the clouds are smaller and lead to greater scattering of incoming solar. So now we enter a period where 'scrubbing' of pollutants is occurring at an ever greater pace across China. The areas down wind ( Pacific) will instantly benefit from the loss of the particulate pollutants. This in turn 'alters' the droplet size in the clouds and so the scattering that takes place leading to higher levels of solar hitting the ocean. result? warmer sst's. Is the record high jan PDO some measure of this?
|
|
|
|
Post by sigurdur on Feb 20, 2015 18:20:09 GMT
Sure there are past instances of the triple r but were they during times of vastly reduced sea ice cover/land snow pack cover? Nope they were not. So should we be mindful of this 'novel forcing'? Well the sst for jan's PDO measure seems to offer some clues does it not? Over the past 20yrs we have studied the impacts of 'soot' on cloud formation noting that the 'un natural' particulates from human pollution lead to condensation nuclei much smaller than those produced in nature ( sea salt wildfire soot etc) and so the droplets in the clouds are smaller and lead to greater scattering of incoming solar. So now we enter a period where 'scrubbing' of pollutants is occurring at an ever greater pace across China. The areas down wind ( Pacific) will instantly benefit from the loss of the particulate pollutants. This in turn 'alters' the droplet size in the clouds and so the scattering that takes place leading to higher levels of solar hitting the ocean. result? warmer sst's. Is the record high jan PDO some measure of this? Graywolf: The snow pack of the late 30's and early 1940's, in the USA, is very similar to what is happening today. You like to mention atmospheric clarity, the Brightness factor per se. It has been increasing since 1996, no doubt about that. Has the level of pollution from China finally stated to fall. Yes. Will this result is less black carbon ice melt effect in the Arctic. One would certainly hope so. That is an anthropogenic effect, the black carbon. Is the current level of sea ice in the Arctic affected by this? Most certainly. Are you finally figuring out that SW (solar) radiation is what heats the oceans? It does appear to be the case, thankfully. Is the earth, with its lack of El Nino's trying to preserve the level of heat that has accumulated in the oceans? Yep.......that is a slam dunk. What is more frightening is............we finally GET an El Nino, release this heat, and then go off the cliff cooling off. Mankind is doing very well today with the current climate regime. Never has there been so much food produced, economic wealth created, folks just over all doing better. A drop of .5 or even 1.0C will cause severe disruption to food stocks, which in turn will cause severe disruption to economies as unrest will escalate. Myself, I would prefer the El Nino to remain silent. We could get lucky and have a blurp of warming when the AMO hits the zero line, and maybe get lucky and have another when the AMO is 1/2 down below that zero line? Once again, warmth is our friend, cold is our enemy in regards to man kinds overall growth/benefit. |
|
|
|
Post by icefisher on Feb 21, 2015 2:06:10 GMT
Sure there are past instances of the triple r but were they during times of vastly reduced sea ice cover/land snow pack cover? Nope they were not. So should we be mindful of this 'novel forcing'? Well the sst for jan's PDO measure seems to offer some clues does it not? Nope? ? Captain Larsen could not have made his 1944 voyage through the Northwest passage last summer, his passage was completely blocked by ice. So did you actually mean "but were they during times of vastly increased sea ice cover. . . ."? |
|


