|
|
Post by sigurdur on Jan 28, 2015 3:59:06 GMT
|
|
|
|
Post by graywolf on Feb 18, 2015 10:34:48 GMT
Looks like no let up in the Triple R blighting the west coast U.s. ( and alaska)? Climate models that are run with reduced sea ice over the Arctic basin faithfully reproduce the ridiculously resilient ridge ( and east coast trough) so I have to wonder if this has played a part in the positioning over the past years? The other side being that the high has allowed sst's in the PDO region to spike positive. with china now reducing particulate/sulphate emmisions I also wonder as to the impact of a reduction in 'dimming' over the Pacific and these high sst's? Could AGW be forcing PDO into a 'positive state' by forcing both the triple R and the high pacific sst's?
|
|
|
|
Post by sigurdur on Feb 18, 2015 16:57:24 GMT
Looks like no let up in the Triple R blighting the west coast U.s. ( and alaska)? Climate models that are run with reduced sea ice over the Arctic basin faithfully reproduce the ridiculously resilient ridge ( and east coast trough) so I have to wonder if this has played a part in the positioning over the past years? The other side being that the high has allowed sst's in the PDO region to spike positive. with china now reducing particulate/sulphate emmisions I also wonder as to the impact of a reduction in 'dimming' over the Pacific and these high sst's? Could AGW be forcing PDO into a 'positive state' by forcing both the triple R and the high pacific sst's? Yes, the RRR is very similar to the 1940's time period. Amazing that eh? The actual question, which isn't well answered or......even answered is: What causes the RRR with the reduction in Arctic Ice. Is the Arctic Ice reduction the cause, or the effect? Has the increasing clarity of our atmosphere since 1996 played a role? Are the extent/conditions presently the inertia of the ever increasing Solar Max during the 1950-2000 time period? Is the lack of an El Nino a response of the earth to try and maintain current temperature? We all know that an El Nino event is actually a huge release of energy, which then departs the earth. We also know that climate goes through step changes, in regards to temperatures. The 15+ year pause in the rise of surface temps is now getting longer in the tooth. Which direction will the next step take us? Some say down, others say up. The movie is a long playing one, be sure and have adequate popcorn..  |
|
|
|
Post by graywolf on Feb 20, 2015 11:34:58 GMT
I'd often pondered what the mechanism was that allowed the pattern of ridge/trough to alter in 2012 but the stream of low sea ice models producing the same configuration seals it for me. And 'Yes' this set up can also be produced by nature but what are the odds that low sea ice over Beaufort/East Siberian do nothing to this set up? Post 07' we saw the impacts of low sea ice ( winter and summer) over the Atlantic side of the basin ( washout summers in the UK as the Jet plunged south of the UK but upstream you had a ridge over the centre of the US with a trough on the west coast ( keeping Alaskan temps low from 07' to 2012)
As for the Arctic being a 'heat sink'? Well the well documented temp inversions over the basin appear very efficient at 'locking in' the heat and limiting radiation out into the winter night? Increased atmospheric moisture content across the basin also aids in heat retention ( as the DMI 80N temp plots for the past 20 years illustrates).
Spin on into summer and what might we see? Well with the PDO into year two of an increasingly strong positive signal we will be seeing folk wonder if it has 'flipped' into its positive state? IPO also looks like it is moving into positive with a lowering of wind over the Pacific ( so allowing surface warming and not driving overturning/upwelling of cold). Lowered wind speeds over the Pacific basin will also impact the tropical warm pool in the west. With high wind speeds no longer keeping the 'warm bulge' penned in it will ease out into the pacific ( giving a modoki ENSO configuration).
With ocean temps far less mobile than land temps we look to be entering another warm year globally?
|
|
|
|
Post by greyviper on Feb 20, 2015 16:12:42 GMT
There are a lot of variables that could affect temperature distribution, wave patterns and the like. I guess it would be advantageous of climatologists would have access to powerful tools in order to at least correctly model and simulate the actual scenario. In this age of technological advancements I believe it is fairly doable and achievable.
|
|
|
|
Post by sigurdur on Feb 20, 2015 17:56:14 GMT
|
|
|
|
Post by sigurdur on Feb 20, 2015 17:58:06 GMT
I'd often pondered what the mechanism was that allowed the pattern of ridge/trough to alter in 2012 but the stream of low sea ice models producing the same configuration seals it for me. And 'Yes' this set up can also be produced by nature but what are the odds that low sea ice over Beaufort/East Siberian do nothing to this set up? Post 07' we saw the impacts of low sea ice ( winter and summer) over the Atlantic side of the basin ( washout summers in the UK as the Jet plunged south of the UK but upstream you had a ridge over the centre of the US with a trough on the west coast ( keeping Alaskan temps low from 07' to 2012) As for the Arctic being a 'heat sink'? Well the well documented temp inversions over the basin appear very efficient at 'locking in' the heat and limiting radiation out into the winter night? Increased atmospheric moisture content across the basin also aids in heat retention ( as the DMI 80N temp plots for the past 20 years illustrates). Spin on into summer and what might we see? Well with the PDO into year two of an increasingly strong positive signal we will be seeing folk wonder if it has 'flipped' into its positive state? IPO also looks like it is moving into positive with a lowering of wind over the Pacific ( so allowing surface warming and not driving overturning/upwelling of cold). Lowered wind speeds over the Pacific basin will also impact the tropical warm pool in the west. With high wind speeds no longer keeping the 'warm bulge' penned in it will ease out into the pacific ( giving a modoki ENSO configuration). With ocean temps far less mobile than land temps we look to be entering another warm year globally? That is what Astromet forecast 2 years ago. |
|
|
|
Post by sigurdur on Feb 20, 2015 17:59:55 GMT
There are a lot of variables that could affect temperature distribution, wave patterns and the like. I guess it would be advantageous of climatologists would have access to powerful tools in order to at least correctly model and simulate the actual scenario. In this age of technological advancements I believe it is fairly doable and achievable. The variables are so variable, that even 12 hour forecast runs run into trouble. The computing power is there, but the understanding of atmospheric interactions, sudden switches etc is not there. |
|
|
|
Post by sigurdur on Feb 20, 2015 19:00:52 GMT
Sounds like another crummy winter next year in the PNW. Code: That depends on whether you like to ski or not....  |
|
|
|
Post by sigurdur on Feb 20, 2015 21:03:36 GMT
www.scientificamerican.com/article/weird-winter-weather-plot-thickens-as-arctic-swiftly-warms/ Weird Winter Weather Plot Thickens as Arctic Swiftly Warms Scientists are working out potential linkages between rapid Arctic warming caused by climate change and a more wavy jet stream causing weird winter weather February 19, 2015 |By Jennifer Francis and The Conversation US The polar jet stream—a fast river of wind up where jets fly that circumnavigates the northern hemisphere—has been doing some odd things in recent years. Credit: Stuart Rankin/Flickr More In This Article A Wacky Jet Stream Is Making Our Weather Severe A Wacky Jet Stream Is Making Our Weather Severe Editor's note: The following essay is reprinted with permission from The Conversation, an online publication covering the latest research.
|
|
|
|
Post by missouriboy on Feb 21, 2015 6:12:56 GMT
Looks like no let up in the Triple R blighting the west coast U.s. ( and alaska)? Climate models that are run with reduced sea ice over the Arctic basin faithfully reproduce the ridiculously resilient ridge ( and east coast trough) so I have to wonder if this has played a part in the positioning over the past years? The other side being that the high has allowed sst's in the PDO region to spike positive. with china now reducing particulate/sulphate emmisions I also wonder as to the impact of a reduction in 'dimming' over the Pacific and these high sst's? Could AGW be forcing PDO into a 'positive state' by forcing both the triple R and the high pacific sst's? We also know that climate goes through step changes, in regards to temperatures. The 15+ year pause in the rise of surface temps is now getting longer in the tooth. Which direction will the next step take us? Some say down, others say up. The movie is a long playing one, be sure and have adequate popcorn.. I decided it was time to see what climate trends I might detect in my small part of North America, Columbia, Missouri. We lie very close to the dead center of the US. So, I downloaded 125 years of monthly climate data from the National weather service and started graphing. Interesting results. The data adjusters do not seem to have had much of an effect on our data, as you can see in the 5-year moving average of mean annual monthly temperatures (shown in first graph). Deviations from the 125-year normal were highest in the 1930s and 1950s, declined to below normal in the 1970s, then climbed back to above normal by 2004 ... still well below the 30-50 period. Since 2004, we seem to have gone flat. However, things get very interesting when you look at the same trends by season ... specifically summer vs winter, as shown in the second graph. Very cold winter periods seem to occur around break points in the solar cycle sunspot time series ... every 35 to 40 years. Summer temps continue to rise for 2 or 3 years past the winter temp high points, then they too collapse. We appear to be entering another of these periods...our winter temps have been dropping for the last 3 years, while our summer temps continue to rise. This winter will likely end up slightly below normal ... unlike areas further north and east that may be well below normal. Is the fat canary preparing to step up to the microphone?   My first attempt at posting images...hope they're large enough. |
|
|
|
Post by icefisher on Feb 21, 2015 8:06:37 GMT
Ohoh, the phones are starting to ring for airline reservations for scientists to come out there and find out whats wrong with Missouri climate records.
|
|
fred
New Member

Posts: 48
|
Post by fred on Feb 21, 2015 9:40:46 GMT
Everybody calculates, computes and graphs the high temperatures but does anybody ever look at the trend in the lowest temperatures?
Are there any unusual trends in them especially now we see these dramatic cold state of the east coast?
|
|
|
|
Post by nautonnier on Feb 21, 2015 12:14:50 GMT
www.scientificamerican.com/article/weird-winter-weather-plot-thickens-as-arctic-swiftly-warms/ Weird Winter Weather Plot Thickens as Arctic Swiftly WarmsScientists are working out potential linkages between rapid Arctic warming caused by climate change and a more wavy jet stream causing weird winter weather February 19, 2015 |By Jennifer Francis and The Conversation US The polar jet stream—a fast river of wind up where jets fly that circumnavigates the northern hemisphere—has been doing some odd things in recent years. Credit: Stuart Rankin/Flickr More In This Article A Wacky Jet Stream Is Making Our Weather Severe A Wacky Jet Stream Is Making Our Weather Severe Editor's note: The following essay is reprinted with permission from The Conversation, an online publication covering the latest research. Strange I don't see any 'swift warming' of the Arctic 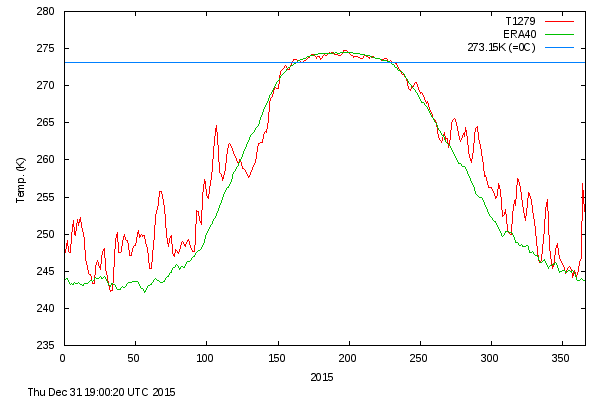 I see bouncing around at minus temperatures during the winter and the last 2 summers have been below average. The winter bouncing around is due to the same latitudinal jetstreams that the other articles are talking about. Cold air that would have remained in the arctic is being pulled equatorward and replaced by warm air moving poleward. So the temperature variances are just what you would expect. The amount of 'cold' is still about the same. As Joe Bastardi would say, there is only so much cold to share around. Look at the current current jet streams here You can see Code in the North West is happily under a warm poleward flow whereas the rest of the USA is North of an equatorward flow. This has set in with a blocking omega high. Meanwhile GreyWolf is just about to get the effect of an equatorward flow looks a little windy and cold over the next few days in Yorkshire. |
|
|
|
Post by graywolf on Feb 21, 2015 14:29:45 GMT
What is the DMI 80N reconstruction of temps going to tell you of what is occurring in the Arctic circle Naut? When you look at depth of permafrost melt over the Arctic circle you will see just how swift change has been?
The one thing the DMI80N temp is good to illustrate is the way sea ice pegs back temps over the melt season. So long as there is ice, melting or otherwise, then the temp is pegged to around zero. remove that ice and temps soar. Keep an eye on land temps where the sea ice has retreated over summer and see the dramatic leaps in temp they have experienced since the ice went. Most years now post record high temps from stations around the Greenland coast.
|
|


