|
|
Post by sigurdur on Mar 23, 2016 16:22:20 GMT
|
|
|
|
Post by sigurdur on Mar 28, 2016 15:20:23 GMT
Starting to look more and more like 1983, in regards to US summer weather pattern.
The large cool pool of water in the Northern Pacific is a large driver of US precip and temperature.
|
|
|
|
Post by sigurdur on Mar 28, 2016 23:17:29 GMT
|
|
|
|
Post by sigurdur on Mar 28, 2016 23:42:57 GMT
|
|
|
|
Post by sigurdur on Mar 29, 2016 1:17:35 GMT
Dang, the classes are almost all sold out!
|
|
|
|
Post by sigurdur on Mar 29, 2016 16:46:32 GMT
|
|
|
|
Post by sigurdur on Mar 30, 2016 19:06:24 GMT
|
|
|
|
Post by Ratty on Mar 30, 2016 22:58:14 GMT
Switching to profitable crops is understandable. Of course, with the coming of the New Order, farmers will be told what they can plant. Makes sense.  |
|
|
|
Post by missouriboy on Apr 6, 2016 16:44:59 GMT
Is this how a solar minimum will begin to look more and more often? The surplus won't last forever. |
|
|
|
Post by sigurdur on Apr 6, 2016 17:17:02 GMT
Is this how a solar minimum will begin to look more and more often? The surplus won't last forever. I haven't looked at that, but an interesting thought. I don't know if the resolution is good enough to show unplanned cold sweeps down the central USA. No, the surplus won't last forever, and farmers may not either. Wheat down $0.13 again today, basis levels rising because no one wants the stuff. Funny tho, has bread gone down in price? Because when wheat was rising in price, remember how a loaf had to rise a buck to cover the $0.07 cost per loaf of increased flour prices? We don't buy bread, so my recollections aren't going to be very good. But I don't remember anyone noticing a large price drop lately??? |
|
|
|
Post by missouriboy on Apr 6, 2016 17:22:28 GMT
Now that is interesting ... as were the comments following. Argo is starting to have a slow turnaround. December is the last month I have., which means we are 3 months behind. Will have to pay more attention to the SST images, but I don't have them in a digital format that I can analyze. I'll have to see if I can remedy that. |
|
|
|
Post by missouriboy on Apr 6, 2016 17:29:02 GMT
Is this how a solar minimum will begin to look more and more often? The surplus won't last forever. I haven't looked at that, but an interesting thought. I don't know if the resolution is good enough to show unplanned cold sweeps down the central USA. No, the surplus won't last forever, and farmers may not either. Wheat down $0.13 again today, basis levels rising because no one wants the stuff. Funny tho, has bread gone down in price? Because when wheat was rising in price, remember how a loaf had to rise a buck to cover the $0.07 cost per loaf of increased flour prices? We don't buy bread, so my recollections aren't going to be very good. But I don't remember anyone noticing a large price drop lately??? No ... I haven't noticed any declines. That's for sure. Funny how prices of the finished goods never quite seem to land as low as one expects. Noticed that with gasoline as well. Seems that I remember gas was cheaper the last time oil was this low. Or, am I just losing brain cells??? |
|
|
|
Post by missouriboy on Apr 6, 2016 18:06:17 GMT
Seems like we have the exact opposite pattern currently than the early May 2012 one. Cold central Pacific anomalies butting up to still warmer than normal water off western N America. So what does that give us for late May??? Snow???  And the N Atlantic blue blob is expanding again.  |
|
|
|
Post by sigurdur on Apr 6, 2016 18:24:42 GMT
Well, I remember having all my corn in on May 12th, and it snowed about 10". Everyone figured my corn would all rot. It didn't.....
|
|
|
|
Post by missouriboy on Apr 6, 2016 19:45:33 GMT
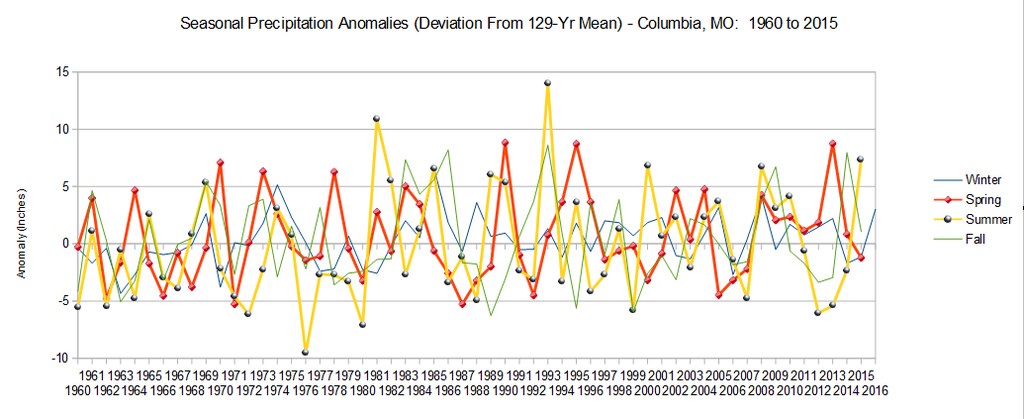
Starting to look more and more like 1983, in regards to US summer weather pattern. The large cool pool of water in the Northern Pacific is a large driver of US precip and temperature. Here, on the southern edge of the Great Plains - Mid-west it looks like this 1983 pattern produced slightly less summer precipitation than normal. But not as low as 2012 (with the warmer than normal central Pacific). I have precipitation graphs, but I can't post them because our site quota has been reached ... Still.
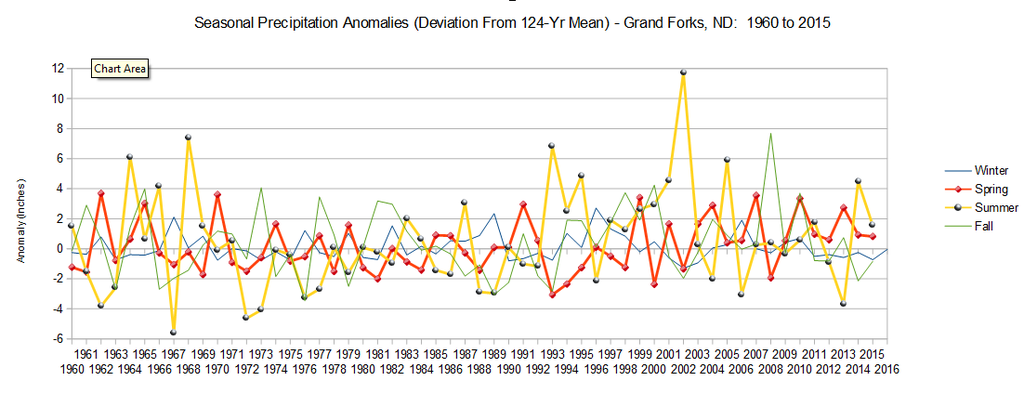
Houray! It works. The following two graphs show annual seasonal precipitation anomalies for Columbia, MO and Grand
Forks, ND for 1960-2015 for comparison to those Pacific SST anomalies.
  |
|


 And the N Atlantic blue blob is expanding again.