|
|
Post by missouriboy on Aug 25, 2016 6:25:06 GMT
Ran across this while I was searching for info on the winter of 1948-49. The deviation chart on the previous page shows this very deep temperature spike. I believe that Sig posted a video of a Dakota blizzard back many months ago, that may
have been the same one.
The article states that this terrible winter followed a particularly good harvest.
The Great Plains states are known for severe winters, but the winter of 1948-49 was one of Nebraska's worst. During a warm September and October of 1948, farmers brought in an outstanding harvest of corn, wheat, and soybeans. They were having good luck. But in November, their luck ran out.
www.livinghistoryfarm.org/farminginthe40s/life_30.html
Note the N Atlantic temperature plunge that occurred just prior to this winter. |
|
|
|
Post by acidohm on Aug 25, 2016 9:10:43 GMT
Ran across this while I was searching for info on the winter of 1948-49. The deviation chart on the previous page shows this very deep temperature spike. I believe that Sig posted a video of a Dakota blizzard back many months ago, that may
have been the same one.
The article states that this terrible winter followed a particularly good harvest.
The Great Plains states are known for severe winters, but the winter of 1948-49 was one of Nebraska's worst. During a warm September and October of 1948, farmers brought in an outstanding harvest of corn, wheat, and soybeans. They were having good luck. But in November, their luck ran out.
www.livinghistoryfarm.org/farminginthe40s/life_30.html
Note the N Atlantic temperature plunge that occurred just prior to this winter.The winter of '46/'47 was the worst of the century in UK, was exceptionally warm in December, exceptionally cold jan-march |
|
|
|
Post by missouriboy on Aug 25, 2016 13:45:45 GMT
Ran across this while I was searching for info on the winter of 1948-49. The deviation chart on the previous page shows this very deep temperature spike. I believe that Sig posted a video of a Dakota blizzard back many months ago, that may
have been the same one.
The article states that this terrible winter followed a particularly good harvest.
The Great Plains states are known for severe winters, but the winter of 1948-49 was one of Nebraska's worst. During a warm September and October of 1948, farmers brought in an outstanding harvest of corn, wheat, and soybeans. They were having good luck. But in November, their luck ran out.
www.livinghistoryfarm.org/farminginthe40s/life_30.html
Note the N Atlantic temperature plunge that occurred just prior to this winter.The winter of '46/'47 was the worst of the century in UK, was exceptionally warm in December, exceptionally cold jan-march I think I've seen this before ... where winters of note pair off across the Atlantic. One bad year on one side, and next year bad on the other. |
|
|
|
Post by acidohm on Aug 25, 2016 15:46:15 GMT
The last run of severe winters you guys had came after a few bad ones here (09-12 approx) or were these cooler stateside too??
|
|
|
|
Post by missouriboy on Aug 25, 2016 19:53:45 GMT
The last run of severe winters you guys had came after a few bad ones here (09-12 approx) or were these cooler stateside too? Central England winters of 2008-09, 2009-10 and 2010-11 appear to correspond with the Midwestern US winters as well as 1995-96 and 1996-97. You guys missed our 2013-14 winter. Pretty good coincidence in winters although the deviations are 5 times as large in the Midwest. Thank Mother Atlantic for that.  You get neither as warm or as cold. 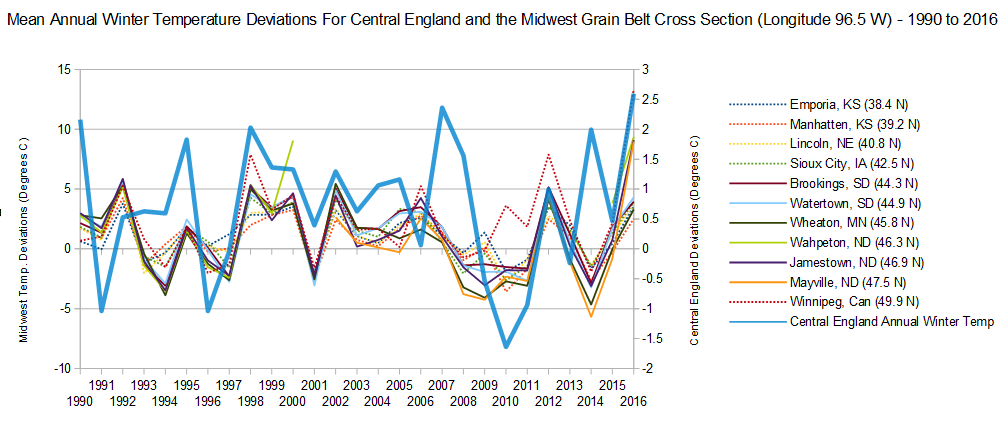 |
|
|
|
Post by missouriboy on Aug 25, 2017 22:21:24 GMT
An incredibly good summary of selected climate trends in the Mid-West from your Deplorable Climate Science Blog guy, Tony Heller. Give em hell Tony. www.youtube.com/watch?v=D4BjFDN1d8wAnd of course I need to supplement it with Mean Daily Maximum Temperature Trends for Columbia, Missouri, where 5-year trends have declined by 6 F since 2007. 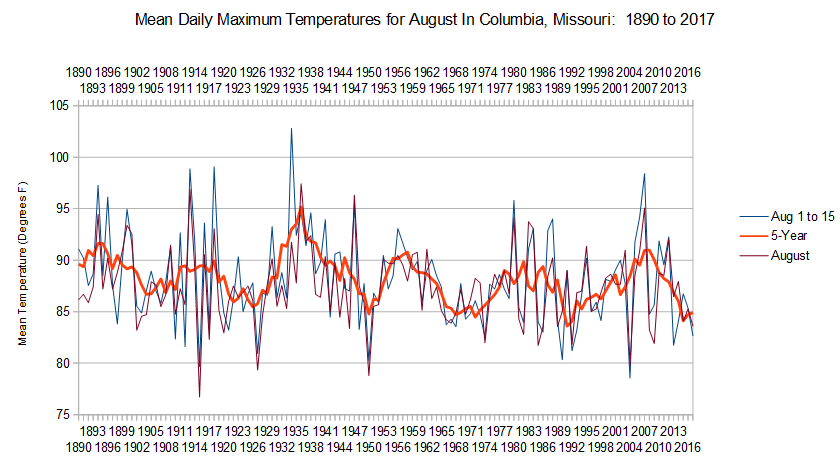 |
|
|
|
Post by blustnmtn on Apr 20, 2018 17:50:01 GMT
|
|
|
|
Post by missouriboy on Feb 15, 2019 18:06:34 GMT
Winter and Spring Month Decadal Trends in the North American Grain Belt from 44 N to 48 N LatitudeI just updated my Midwest stations through December, 2018. While all climates differ, this south-north latitudinal reach is comparable to Romania or France (from Nice to Paris). These temperature deviations are computed on the currently standard base period 1981-2010, thus incorporating the high points of solar cycles 22 and 23. Negative values thus incorporate the generally cooler periods of solar cycles 20 and 21, together with the increasingly cool period of solar cycle 24. Ten year smoothing eliminates most of the noise of year to year values. I'll call it "the rolling third of a climate view", and is closer to the length of a solar cycle. The two core winter months show a peak about 1987. January shows a steep 4-5 C rise out of the the 1960s-70s cool period followed by a general leveling off, with moderate downturns centered on the solar cycle minimums and El Nino years centering on 1997 and 2009-10. February shows a similar rise to a 16 year plateau followed by a steep decline to levels comparable to the 1960s-70s cool period. Station bands are tightly grouped at the peaks and spread in the cooler periods. Late winter and early spring temperatures show the 2-3 C rise, peaking about 1990 followed by generally declining trends. As expected, March shows great variance in the cooler periods across 4 degrees of latitude. The more southern stations have remained marginally above the 1981-2010 mean, but the more northern stations appear to be dropping back to 1960s-70s cool period levels. April has less variance, but shows a 2 C decline centered on 1997 with a recovery during solar cycle 23. Since about 2008, April values have plummeted by 2.5 to 3 C for all stations and are now at levels well below those of the 1960s-70s. Late spring to early summer (May and June) show the same general temperature change staging, with a peak about 1990. This is followed by a decline bottoming around the 2008-2009 solar minimum, followed by small rise in solar cycle 24, which appears to have peaked in 2017 and may now be declining. 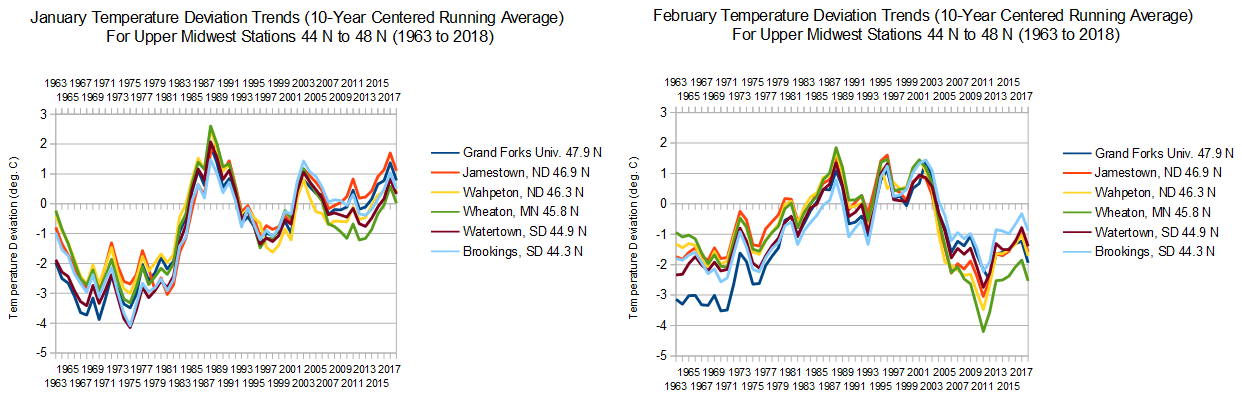 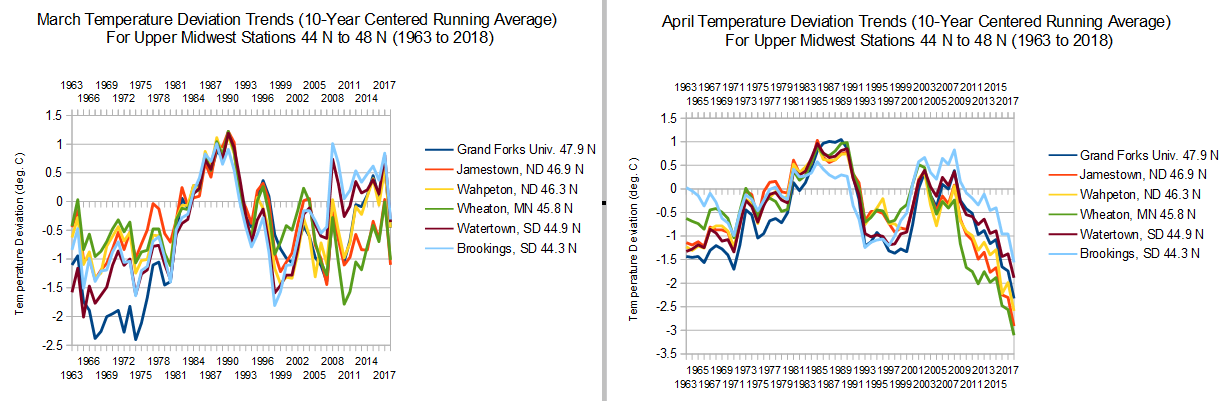 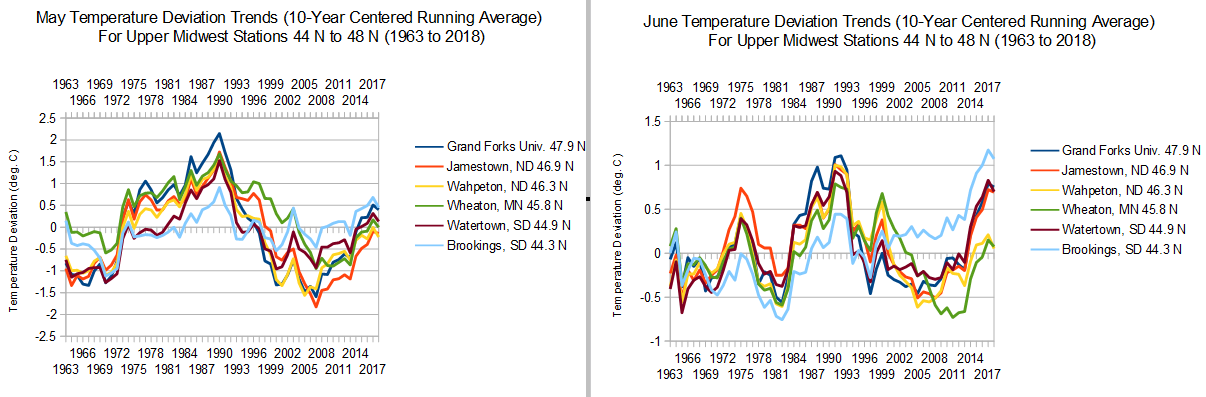
|
|
|
|
Post by missouriboy on Aug 19, 2019 17:00:41 GMT
Trends in Cloud Cover For the Upper Midwest From Columbia, MO (39 N Lat.) to Minneapolis, MN (45 N Lat.) - 2012 to 2019These values are only available on the Preliminary Monthly Climate Data for reporting stations that are shown on the NWS Website. They are available daily and monthly going back 5 years. If they are stored, they are not available on the standard long-term time series. I started collecting these manually in 2017, so they only go back to 2012 unfortunately. Would love to compare the last solar minimum to the current. There is a distinct upward trend across these 7 years mostly concentrated in 2018-19 of about 10% across the entire 6-degree cross section. The northern 2 stations appear to be maintaining their differential to Columbia. Des Moines is just over 200 miles north of us, but is distinctly more like Minneapolis than Columbia. You can see this differential in temperatures as well, particularly in winter. 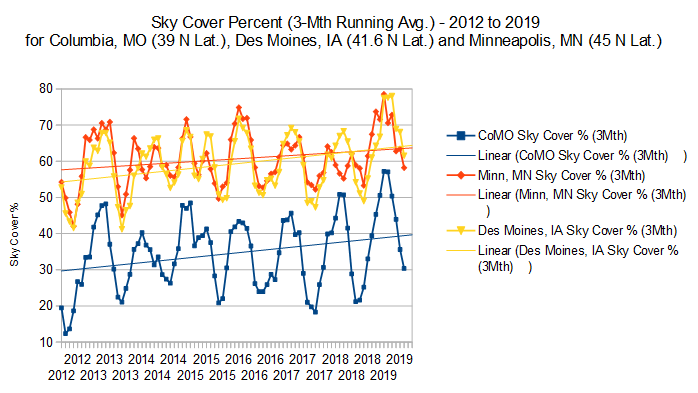
|
|
|
|
Post by Ratty on Aug 19, 2019 23:11:59 GMT
Making clouds great again?  |
|
|
|
Post by blustnmtn on Aug 24, 2019 11:41:07 GMT
Trends in Cloud Cover For the Upper Midwest From Columbia, MO (39 N Lat.) to Minneapolis, MN (45 N Lat.) - 2012 to 2019These values are only available on the Preliminary Monthly Climate Data for reporting stations that are shown on the NWS Website. They are available daily and monthly going back 5 years. If they are stored, they are not available on the standard long-term time series. I started collecting these manually in 2017, so they only go back to 2012 unfortunately. Would love to compare the last solar minimum to the current. There is a distinct upward trend across these 7 years mostly concentrated in 2018-19 of about 10% across the entire 6-degree cross section. The northern 2 stations appear to be maintaining their differential to Columbia. Des Moines is just over 200 miles north of us, but is distinctly more like Minneapolis than Columbia. You can see this differential in temperatures as well, particularly in winter. I think Svensmark would like to see this Mo’boy. |
|
|
|
Post by missouriboy on Aug 24, 2019 13:22:20 GMT
You got his email Blu? |
|
|
|
Post by blustnmtn on Aug 24, 2019 15:23:26 GMT
You got his email Blu? This is his email listed at the university: hsv@space.dtu.dk I think you should contact him. |
|
|
|
Post by missouriboy on Aug 24, 2019 16:00:55 GMT
You got his email Blu? This is his email listed at the university: hsv@space.dtu.dk I think you should contact him. I should try ... but my time series is "pitifully" small. |
|
|
|
Post by blustnmtn on Aug 24, 2019 17:25:24 GMT
This is his email listed at the university: hsv@space.dtu.dk I think you should contact him. I should try ... but my time series is "pitifully" small. Perhaps, but unlike many, you don’t adjust the data. It’s a nice snapshot covering the double peak and decay of cycle 24. |
|


 You get neither as warm or as cold.

