|
|
Post by missouriboy on Jan 15, 2018 18:24:33 GMT
1870-1890's. Mass migration to Manitoba, Canada. Reason was cold period, even the Cod moved south which really hurt. Also, the volcano wasn't silent. One of many....LOL. If you believe that pressure patterns between 35 N and 65 N (NAO) are a general proxy for temperature assemblages in the North Atlantic, then I direct your attention to summer NAO values (the surface pressure gradients) between the Azores and Iceland. They were very low in the 1870s-90s. They had returned to these values by 2000 and have dropped further since. Compare the summer values circa 1821 with today ... striking. Chart 2 seems to indicate that this is due to a decline in pressure at 35 N (unlike winter). If summer determines whether you 'make it' or not, is that what drove the 1870s-90s migration? You get a negative pressure gradient by either raising the pressures at Iceland OR lowering the pressures at 35 N. In the case of the 1870s-90s, both seem to have occurred. This summer pressure pattern did not occur in the 1960s-70s. What is different? 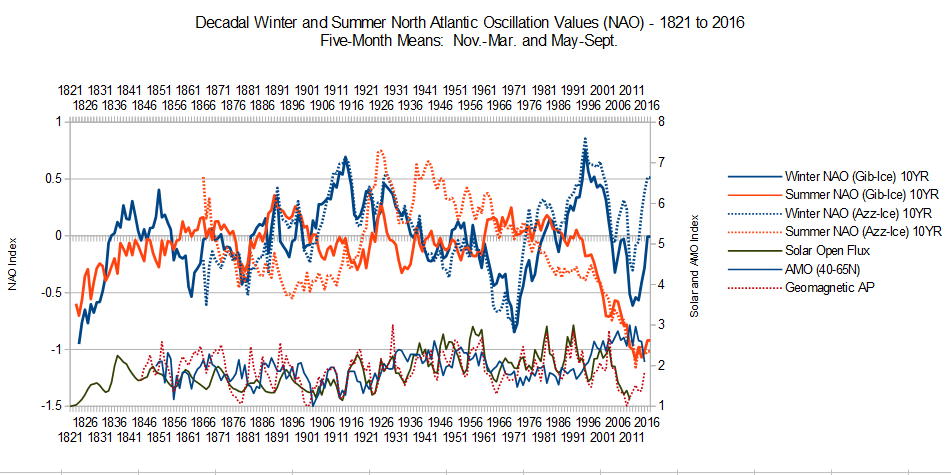 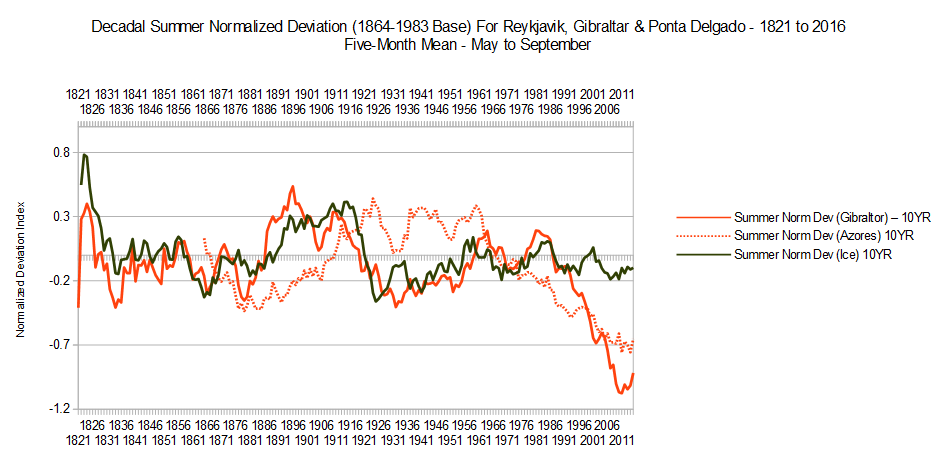 ICELAND Update This is a temporary graph for two iceland stations until I can incorporate the NAO data. However, it is quite obvious that the negative summer NAO trend is mirrored in the temperature data for the 1870s-90s. The 1930s mid-summer temperatures are at least as high as 2006-08 and they are currently on their way down. The 1960s-70s cooled by about 1 C in Reykjavik, while Stykkisholmur July temps declined by perhaps 2 C in the 1870s-80s. If current temperatures have been 'supported' by the Gulf Streams' buffering capacity, then the next few years should be a good test of how fast they might fall (or not). They have already declined by about 1 C. People downplay pressure gradient (NAO) effects in summer, but I'm not convinced that's true. 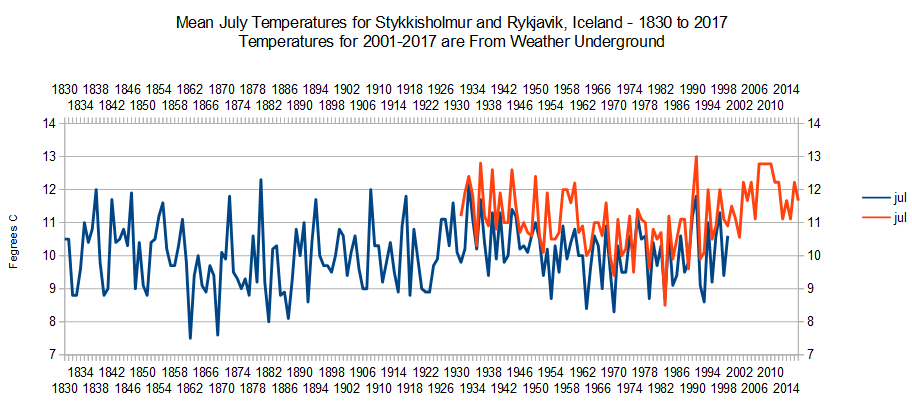 |
|
|
|
Post by missouriboy on Jan 15, 2018 18:39:39 GMT
Thank you Sig. I'm poaching all the data. |
|
|
|
Post by sigurdur on Jan 15, 2018 18:48:42 GMT
"This summer pressure pattern did not occur in the 1960s-70s. What is different?"
I don't know.
An area to look at tho, is what condition was the Pacific in at that time? Contrary to popular myth, both Atlantic and Pacific oceans along with northern seas affect the conditions far removed from their basins.
Just an idea to look at, confirm some parallel or not?
|
|
|
|
Post by acidohm on Jan 15, 2018 19:47:15 GMT
Looks a bit like post LIA warming with AMO fluctuations?? Good find Sig! Interesting. |
|
|
|
Post by missouriboy on Jan 15, 2018 20:15:31 GMT
"This summer pressure pattern did not occur in the 1960s-70s. What is different?" I don't know. An area to look at tho, is what condition was the Pacific in at that time? Contrary to popular myth, both Atlantic and Pacific oceans along with northern seas affect the conditions far removed from their basins. Just an idea to look at, confirm some parallel or not? Re-check the charts I posted above. I just added a first cut chart of the Iceland temperature data. Unfortunately, as Icefisher pointed out, we really don't have good data back that far in the Pacific ... |
|
|
|
Post by wheels59 on Jan 16, 2018 0:12:25 GMT
'What is different' could it be the declining activity of the sun possibly going into a grand minimum that didn't occur in the 60s & 70s
|
|
|
|
Post by missouriboy on Jan 16, 2018 4:19:12 GMT
'What is different' could it be the declining activity of the sun possibly going into a grand minimum that didn't occur in the 60s & 70s It could indeed. Yet we must ultimately describe and quantify the forces and mechanisms through which weather, and ultimately climate, change. If the other side loses, they can look forward to an epitaph similar to ... "They failed as a scientist, not because they were wrong, but because they were corrupt. They swilled at the public trough with the best con men of their time". Let us not be like them. |
|
|
|
Post by AstroMet on Feb 24, 2018 21:41:00 GMT
'What is different' could it be the declining activity of the sun possibly going into a grand minimum that didn't occur in the 60s & 70s It could indeed. Yet we must ultimately describe and quantify the forces and mechanisms through which weather, and ultimately climate, change. If the other side loses, they can look forward to an epitaph similar to ... "They failed as a scientist, not because they were wrong, but because they were corrupt. They swilled at the public trough with the best con men of their time". Let us not be like them. Well, that's been long done and many times Missouriboy, that is, "describe and quantify the forces and mechanisms through which weather, and ultimately climate, change." It's been done over the centuries. We have to remember that conventional climatology and meteorology is still very young, with their own records going back just a little over a century since 1880 in the western world. However, conventional climatology and meteorology never represented 'science,' rather, they were born from astronomic forecasting of the climate and weather, which has been performed over the entire history of humanity. Human beings always have grown and consumed crops, have traveled and traded amongst populations and have always had to deal with the climate and weather. What's changed over the centuries? As for describing and quantifying the forces and mechanisms through which weather and ultimately climate, change, that's been explained many, many times. Those who don't accept those facts are always those who cannot forecast climate and weather. They prove that by their failures - and do so consistently because they fail to accept and apply the laws of astrophysics. You cannot go around calling the effects 'causes' and be accurate. That means one doesn't have all 52 cards in their deck. Want to get somewhere? Then get both oars in the water. In the final analysis the entire point of Science is the ability to predict. |
|
|
|
Post by AstroMet on Jul 21, 2018 2:45:48 GMT
"This summer pressure pattern did not occur in the 1960s-70s. What is different?" I don't know. An area to look at tho, is what condition was the Pacific in at that time? Contrary to popular myth, both Atlantic and Pacific oceans along with northern seas affect the conditions far removed from their basins. Just an idea to look at, confirm some parallel or not? All of this is because of the Sun's declining electromagnetic and ultraviolet activity which affects not just the Earth's atmosphere but also the ocean basins. |
|
|
|
Post by nautonnier on Jul 22, 2018 18:51:59 GMT
|
|
|
|
Post by nautonnier on Jul 29, 2018 18:49:17 GMT
|
|
|
|
Post by AstroMet on Nov 10, 2018 5:23:18 GMT
|
|
|
|
Post by nautonnier on Nov 21, 2018 1:04:14 GMT
I think that this fits quite well here.... " Astro-Climate-Connection
Monday, November 19, 2018
Is the November 2018 Madden Julian Oscillation (MJO) as a Possible Trigger for an El Nino?
1. The Madden Julian Oscillation (MJO)
The Madden Julian Oscillation (MJO) is the dominant form of intra-seasonal (30 to 90 days) atmospheric variability in the Earth’s equatorial regions (Zang 2005). It is characterized by the eastward progression of a large region of enhanced convection and rainfall that is centered upon the Equator. This region of enhanced precipitation is followed by an equally large region of suppressed convection and rainfall. The precipitation pattern takes about 30 – 60 days to complete one cycle, when seen from a given point along the equator (Madden and Julian 1971, 1972)."
More Here:> astroclimateconnection.blogspot.com/H/t to Tallblokes Talkshop |
|
|
|
Post by nautonnier on Dec 10, 2018 16:12:17 GMT
I thought I would put this here... "Sunday, December 9, 2018
Is the Next Big Westerly Wind Burst On Its Way?
Hypothesis: During periods leading up the onset of El Nino events, nascent Typhoon/Cyclone pairs associated with the active phase of Madden Julian Oscillations are reinforced either at or 1-2 days after the maxima or minima in the Earth's rotation rate that are induced by the monthly lunar tides."
astroclimateconnection.blogspot.com/2018/12/is-next-big-westerly-wind-burst-on-its.html |
|
|
|
Post by AstroMet on Dec 12, 2018 3:37:49 GMT
Global Cooling: 2017-2053 'My El Niño Forecast Confirmed' by Theodore White, astromet.sci In 2006, I forecasted the last El Niño and La Niña to arrive in 2009-2011 I was told that I was the only forecaster in the world to have done so years in advance. I also knew that particular El Niño and La Niña would be the last before the onset of the climate of global cooling, followed by the Sun's Grand Minimum, which is about to get underway. El Niño and La Niña is climate change in action. It is caused by the activity of the Sun relative to the giant gas planets Jupiter and Saturn. These are the warm and cool phases of a recurring climate cycle that occurs across the tropical Pacific Ocean. These are complex, naturally occurring climatic phenomena which occurs every 10 to 11 years according to my calculations. As I was the only forecaster in the world to predict the last one I also forecasted the next El Niño to come in 2019-2020 with a powerful La Niña to follow in 2021-2022. Both El Niño and La Niña affect world patterns and influences various weather events such as heavy precipitation of snow and rain, floods and droughts; along with extreme temperature ranges that lead to heatwaves and cold periods for various global regions. The European Space Agency's Climate Change Initiative uses Earth observation satellites to monitor and measure the effects of El Niño and La Niña in the context of a changing global climate. ESA took the opportunity to post the explanatory video attached, which describes El Niño and its cooler sister, La Niña, as opposite phases of what is known as the El Niño-Southern Oscillation. As the animation shows, the first signs of an El Niño are a weakening of the trade winds and warmer-than-usual sea-surface temperatures in the eastern tropical Pacific Ocean. This not only affects fisheries off the coast of South America, but leads to disruption of weather patterns around the world. It is coming, as I've forecasted... www.youtube.com/watch?time_continue=108&v=04NPZP9U-sc |
|


