|
|
Post by fredzl4dh on May 20, 2015 12:13:16 GMT
|
|
|
|
Post by missouriboy on May 20, 2015 16:27:09 GMT
Great find! The 1921-30 period covers the transition from the negative to the positive AMO. Lots of stations for Iceland and Greenland. And records for many North American cities that can be compared to the 'modern' records. |
|
|
|
Post by missouriboy on Jan 16, 2017 20:57:37 GMT
A Comparison of England and Philadelphia Temperature Records (1772-2016)Some time back I acquired two sets of records for Philadelphia, one from the Franklin Center (1874-2001) and the other from an online source that Fred indirectly pointed to (1790-1846). I merged these and compared them to the CET record. Two charts show 6-month winter and summer 11-year mean comparisons, and one shows the effects of the Tambora eruption in 1850 superimposed on the overall effects of the Dalton Minimum. In general climatic trends are similar on both sides of the N Atlantic. Highs and lows in the record appear in the same location and trends go in the same direction. There is nothing to suggest that the quality of the earlier Philadelphia record is different than the later although the general deviation from the CET is greater. It would appear that the East coast N American climate experience greater extremes than the more maritime climate of England. This can be seen in the 1960s downturn as well. Winter trends are upward across the series although the Philadelphia record slows down after 1930. Summer CET records show a concave trend connecting the warm 1770s with the warm 1990s. Summers in Philadelphia may show a similar trend with a greater cold variance in the early 1800s and a higher peak about 1930 that matches that of 2000. It seems apparent that the effects of the Dalton Minimum were greater in Philadelphia than in England, both in winter and in summer (Charts 1 and 2). Chart 3 shows the summer progression of summer temperatures from 1780 to 1850. The effects of the Mt. Tambora eruption of 1815 on the general effects of the Dalton Minimum are readily apparent, and were greater in Philadelphia. 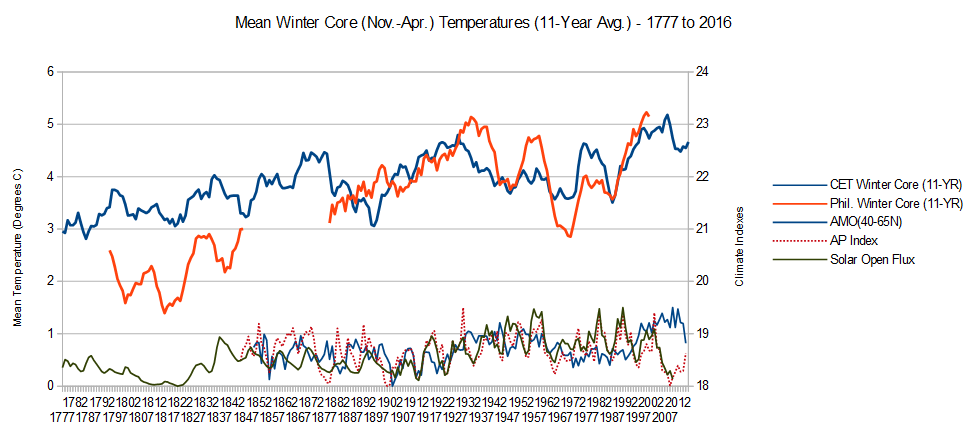 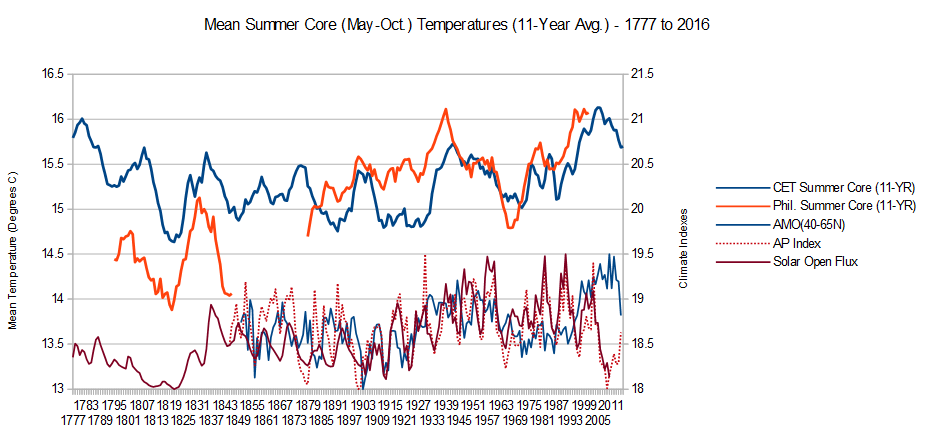 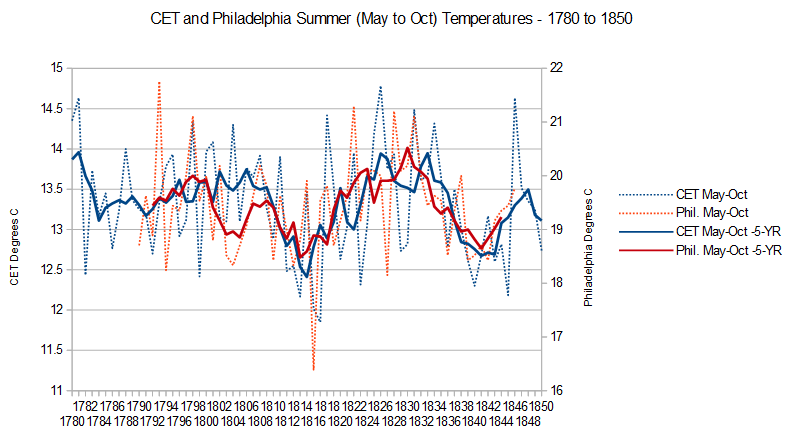
|
|
|
|
Post by sigurdur on Jan 17, 2017 4:03:06 GMT
I am letting your splendid graphs rattle around a bit.
|
|
|
|
Post by missouriboy on Jan 17, 2017 5:11:09 GMT
FOR THE TRIVIA BUFFCan it be that on very rare occasions the climate simply ‘goes mad’?While searching the web for something on the unusually cold CET year of 1740, I came across this. Could this be the true measure of climate science?
onlinelibrary.wiley.com/doi/10.1002/wea.1976/pdf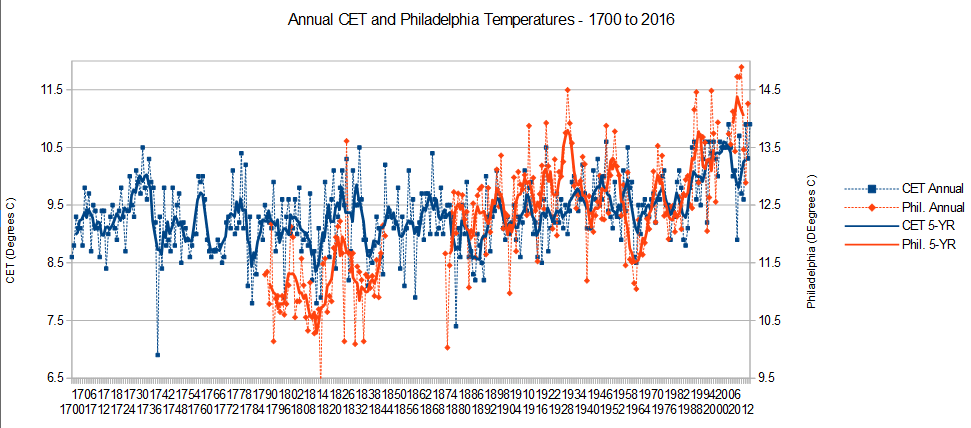 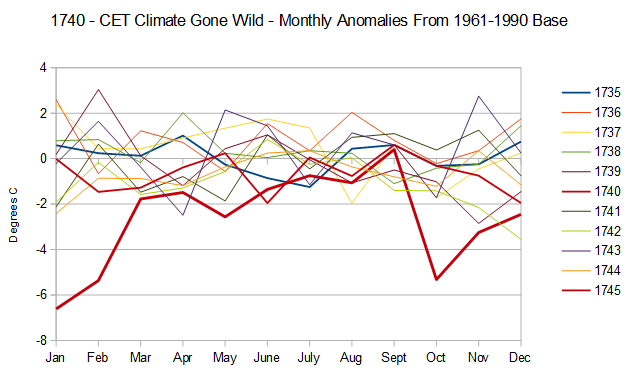
|
|
|
|
Post by missouriboy on Aug 3, 2018 22:51:00 GMT
|
|
|
|
Post by acidohm on Aug 30, 2018 9:15:49 GMT
Some fun facts about UK temperature records.
Earliest 20c: 2nd March 1977
Earliest 25c: 29th March 1929, 1965, 1968
Earliest 30c: 12th May 1945
Latest 20c: 23rd November 1906
Latest 25c: 18th October 1997
Latest 30c: 27th September 1895
Earliest -10c: 20th October 1880
Earliest -15c: 14th November 1919
Earliest -20c: 14th November 1919
Latest -10c: 25th April 1908
Latest -15c: 2nd April 1917
Latest -20c: 14th March 1958
A set of records posted elsewhere....
Quite interesting 🤔
|
|
|
|
Post by Ratty on Aug 30, 2018 12:55:20 GMT
Some fun facts about UK temperature records. Earliest 20c: 2nd March 1977 Earliest 25c: 29th March 1929, 1965, 1968 Earliest 30c: 12th May 1945 Latest 20c: 23rd November 1906 Latest 25c: 18th October 1997 Latest 30c: 27th September 1895 Earliest -10c: 20th October 1880 Earliest -15c: 14th November 1919 Earliest -20c: 14th November 1919 Latest -10c: 25th April 1908 Latest -15c: 2nd April 1917 Latest -20c: 14th March 1958 A set of records posted elsewhere.... Quite interesting 🤔 What does it tell us? Need an Acid Analysis. |
|
|
|
Post by acidohm on Aug 30, 2018 13:01:52 GMT
Of the bat, it hasn't been hot very late in the year for a loooong time. And it certainly used to stay colder for longer.
It just seems contrary to the warmists line that were getting "hotter" in that on the face of it our seasons have subdued somewhat.
If someone claims a year in the UK was hotter recently, it really seems they're saying the cold was less extreme then it has been and the warmth perhaps above average in the warmer months, but it wasn't extreme or lasting outside parameters known over a hundred years ago....
This fits in with the 2003 record high temp that beat the previous 1911 one, and that was 15 years ago.
Since then they've relied on Heathrow and ice cream trucks 🤔
|
|
|
|
Post by missouriboy on Aug 30, 2018 14:56:37 GMT
Of the bat, it hasn't been hot very late in the year for a loooong time. And it certainly used to stay colder for longer.
It just seems contrary to the warmists line that were getting "hotter" in that on the face of it our seasons have subdued somewhat. If someone claims a year in the UK was hotter recently, it really seems they're saying the cold was less extreme then it has been and the warmth perhaps above average in the warmer months, but it wasn't extreme or lasting outside parameters known over a hundred years ago.... This fits in with the 2003 record high temp that beat the previous 1911 one, and that was 15 years ago. Since then they've relied on Heathrow and ice cream trucks 🤔 And looking at the chart posted 3-4 posts ago ... it will likely stay colder for longer again ... soon. Your sons will be able to say, "I remember when we NEVER had snow in winter". If they are not lucky, they can add, "Hell, I remember when we NEVER had snow in the summer".  Looking at the extremes of weather events we apparently are starting to see again, I remembered and re-read the description of such events by James Marusek ... www.breadandbutterscience.com/Weather.htm Ice cream trucks can only disguise minor deviations.  From earliest times, man stood in awe and wonderment as weather unfolded before his eyes. His records like pebbles were collected into chronologies that provide a glimpse of bygone weather. From earliest times, man stood in awe and wonderment as weather unfolded before his eyes. His records like pebbles were collected into chronologies that provide a glimpse of bygone weather.
Sometimes rare events were described as surreal images. In China, tornadoes and waterspouts were often seen as battles between dragons. The tail of the dragon [tornado funnel] was visible, while the dragons fought hidden in the clouds. Then in an instant with a great roar, the dragon would swoop down with its mighty claws and splinter trees or pull them out by the roots, destroy building and scoop up men and cattle into the sky where they were never seen from again.
Early American Indians were more afraid of “pogonip” than rattlesnakes. “Pogonip” translates to “white death”. It is a mist of frozen vapors, microscopic particles of ice, called diamond dust. These particles are so fine that when breathed in, they can perforate the lungs and cause death within a day.
History records hailstones so large that they killed men, horses and cattle. Sometimes storms deposited hailstones to a depth of 10-feet. Extremely rare events describe large slabs of ice falling from the sky, such as in France in 823.
Dust and rain storms collide to create mudstorms that rain down thick mud.
There are historical accounts of “Snow Rollers”, snowballs rolled by strong winds like a jellyroll to form large cylinder of snow, generally in flat fields. A few years back, I was amazed to see a field of snow rollers in Bloomfield, Indiana.
There were winters so severe that wild animals and birds could be approached and picked up by hand. When packs of wolves were driven into the villages and cities in search for food, even human prey. Weather caused famines so severe that the consequences, I don’t even want to speak about. The scale of some of these natural events are breathtaking and the disasters they wrought inconceivable.
|
|
|
|
Post by acidohm on Aug 30, 2018 16:26:37 GMT
The shock could well be both mental and physical!
|
|
|
|
Post by missouriboy on Aug 30, 2018 17:13:27 GMT
The shock could well be both mental and physical! The results equivalent to a cat 8 earthquake from the sky (fast or slow). The priest (insert denomination of choice) would say something regarding the wages of sin. Warmists will say the same thing in a different way. Mann or Man will be blamed. If it were just a rare, natural event, there would be no one to burn at a stake. That, of course, would cut into profits.  Or was that prophets? Same difference normally. |
|
|
|
Post by missouriboy on Aug 30, 2018 17:49:37 GMT
Looking back on that old (2010) post on Watts Up With That? I note the chart on weather stations as far afield as Ireland and Slovakia that show the same trend, which seems to correlate with temperature trends of the North Atlantic. Wouldn't it be interesting to require all new climate research papers to explain how their current "pet" driver of choice would explain such a far-flung relationship? I am assuming (always dangerous) that an update of this chart to include the last decade would show it sliding down a new slope. wattsupwiththat.com/2010/09/26/a-must-read-european-climate-alpine-glaciers-and-arctic-ice-in-relation-to-north-atlantic-sst-record/ |
|
|
|
Post by douglavers on Aug 31, 2018 6:22:17 GMT
It is hardly surprising that European rural station temperatures are correlated with N Atlantic SSTs.
I read somewhere that the top 400 meters of the oceans contain more variable enthalpy than all the atmosphere, by more than three orders of magnitude.[Below 400 meters, the water is at 4 degC, its maximum density]
i.e Atmospheric temperature averages are slaved to SSTS.
This is bad news for Europe, with the N Atlantic cooling rather dramatically in the last six months.
|
|
|
|
Post by acidohm on Aug 31, 2018 9:07:10 GMT
It is hardly surprising that European rural station temperatures are correlated with N Atlantic SSTs. I read somewhere that the top 400 meters of the oceans contain more variable enthalpy than all the atmosphere, by more than three orders of magnitude.[Below 400 meters, the water is at 4 degC, its maximum density] i.e Atmospheric temperature averages are slaved to SSTS. This is bad news for Europe, with the N Atlantic cooling rather dramatically in the last six months. I still maintain that any drop in Atlantic temp is not directly the cause of dramatic reductions on land. When N Europe gets REALLY cold, it's due to northern or easterly winds. If the mild westerlies drop by 5°c, that were probably at 10°c anyway, they're just too warm to get down to freezing conditions. I think rather cooling Atlantic may upset the weather patterns which may perhaps be seen in NAO. The westerly patterns reduces, which opens the back door via blocking. Of course, if the Atlantic drops 10°c were screwed, but perhaps such a drop is unlikely?? |
|


 Or was that prophets? Same difference normally.