|
|
Post by douglavers on Mar 18, 2016 22:04:41 GMT
Nice animation Sigurdur.
a] North Pacific turning cold
b] El Nino fading
c] Huge cold anomaly remains around Antarctic.
7] N Atlantic remains cold - Gulf Stream fades out mid-Atlantic
Interesting times coming.
|
|
|
|
Post by missouriboy on Mar 18, 2016 22:25:37 GMT
|
|
|
|
Post by sigurdur on Mar 19, 2016 3:08:40 GMT
I think there is a lot of validity to the forecast. Looking for an August and onward event tho. |
|
|
|
Post by sigurdur on Mar 19, 2016 3:27:42 GMT
|
|
|
|
Post by missouriboy on Mar 19, 2016 14:22:05 GMT
I think there is a lot of validity to the forecast. Looking for an August and onward event tho. I plotted an ENSO-MEI Winter and Summer Index against precipitation anomalies for two locations in the Mid-West, Columbia, MO and Grand Forks, SD. Positive summer precipitation anomalies of 5 inches or more are noted for all El Nino summers in both locations except for 1997-98 (both locations), where large positive summer anomalies occur in the long La Nina following the event. Is this due to its location?  Summer anomalies were lower in S Dakota for the 2009-10 El Nino than for Missouri. Large positive summer anomalies seem to lag the 1992-93 El Nino. Negative summer precipitation anomalies occurred in central Missouri in 2012-13 following the 2009-10 El Nino and 1-year droughts occurred in 1999 and 2007, while the 1994 response was rather small. In eastern S Dakota, summer negative precipitation anomalies occur in 1996, 2004, 2006 and 2013. We'll see what this La Nina brings (if it occurs), but, in central Missouri we just had the largest Nov-Dec. precipitation event in our 126-year weather record, followed by the dryest Jan-Feb since 1983.   |
|
|
|
Post by sigurdur on Mar 19, 2016 17:29:38 GMT
I looks like the trend will continue to one of drier than average for Grand Forks, ND. That IS?? What you meant Missouriboy?
I am thinking that the pool of cold water in the Northern Pacific affects precipitation patterns. I will have to see where the Greenland High is parked as well, as that directs the direction of boundaries of weather systems.
Have a meeting on April 7th with Dr. Osborn. He is going to give us his take on potential summer weather.
|
|
|
|
Post by missouriboy on Mar 19, 2016 19:00:38 GMT
I looks like the trend will continue to one of drier than average for Grand Forks, ND. That IS?? What you meant Missouriboy? I am thinking that the pool of cold water in the Northern Pacific affects precipitation patterns. I will have to see where the Greenland High is parked as well, as that directs the direction of boundaries of weather systems. Have a meeting on April 7th with Dr. Osborn. He is going to give us his take on potential summer weather. Wish I knew Sig. Following the 2009-10 Nino, we got seriously trashed in summer 2012 while you were about normal. Next year (2013) we both got trashed. While negative precip. anomalies here were the same in both years, the temperatures were much cooler in 2013. I think that the blob is ultimately (this year? next?) history and the N Pacific reverts to its interrupted cold phase. Check out my next post. I went back and put this together. As you've mentioned before, you seem to be on a down trend with precipitation.   |
|
|
|
Post by missouriboy on Mar 19, 2016 19:38:29 GMT
A NEW LOOK AT ENSO (At least to me) I recomposed the ENSO time series to look at the number of months above and below zero as a 10-year (120 Month) centered running average. To my eyes, this really tells a story. Notice the VERY sharp breaks in 1976 (the great climate shift) and 1942 (following the monster El Nino of 1938-39) where the N Pacific shifted to different modes. The 1996-97 El Nino occurred on the flank of the current shift to 'neutral' followed, which was followed by 'the pause'. Will this El Nino finally trigger the next shift? The Bob Tisdale chart below I've posted before, and do so again as it dramatically shows the comparable shift in the S. Pacific. I don't believe in coincidences. If we had a longer series in the S Pacific, I would personally bet we would see an appropriately lagged change. Our current pause is long in comparison to the history (That's assuming that we believe that they got the ENSO history in 'the ball park'). The eight year lag on the front end of the great climate shift has become fifteen on rear end. According to ENSO, the real peak occurred in 1990 and it took eight years to start the pause ... while the S Pacific seems to have shifted in 2000. Will the S Pacific shift again after this El Nino ... AND ... will it be in a negative direction? The more I look at these things, the more I wonder if Mr Flearider's ideas about that big continent of ice (in combination with Mr. Sol) may say something about the culprit. 
|
|
|
|
Post by sigurdur on Mar 19, 2016 22:52:15 GMT
I looks like the trend will continue to one of drier than average for Grand Forks, ND. That IS?? What you meant Missouriboy? I am thinking that the pool of cold water in the Northern Pacific affects precipitation patterns. I will have to see where the Greenland High is parked as well, as that directs the direction of boundaries of weather systems. Have a meeting on April 7th with Dr. Osborn. He is going to give us his take on potential summer weather. Wish I knew Sig. Following the 2009-10 Nino, we got seriously trashed in summer 2012 while you were about normal. Next year (2013) we both got trashed. While negative precip. anomalies here were the same in both years, the temperatures were much cooler in 2013. I think that the blob is ultimately (this year? next?) history and the N Pacific reverts to its interrupted cold phase. Check out my next post. I went back and put this together. As you've mentioned before, you seem to be on a down trend with precipitation. View AttachmentMissouriboy: Grand Forks, ND...  |
|
|
|
Post by missouriboy on Mar 19, 2016 23:31:41 GMT
Wish I knew Sig. Following the 2009-10 Nino, we got seriously trashed in summer 2012 while you were about normal. Next year (2013) we both got trashed. While negative precip. anomalies here were the same in both years, the temperatures were much cooler in 2013. I think that the blob is ultimately (this year? next?) history and the N Pacific reverts to its interrupted cold phase. Check out my next post. I went back and put this together. As you've mentioned before, you seem to be on a down trend with precipitation. Missouriboy: Grand Forks, ND... OOPS ... That's what I meant ... and the data are for ND. My other South.  |
|
|
|
Post by missouriboy on Sept 11, 2016 4:52:06 GMT
|
|
|
|
Post by Ratty on Sept 11, 2016 21:46:05 GMT
|
|
|
|
Post by nautonnier on Sept 12, 2016 13:09:17 GMT
"Research by Nick Bond and others revealed that the Blob is the love child of persistent high pressure. High pressure is associated with weaker winds that result in less mixing in the upper ocean (mixing of cold water up to the surface). It also changes surface ocean currents." cliffmass.blogspot.com/2016/09/the-blob-is-back.htmlHigh pressure and anti cyclones are also associated with descending heating air and cloudless skies. The blob is almost certainly associated with larger amounts of insolation heating the top 100 meters or so of ocean surface. |
|
|
|
Post by AstroMet on Sept 12, 2016 22:22:16 GMT
The so-called 'blob' is due to what is happening with the jet stream flow, that is the ongoing transition from zonal to meridional wind patterns Codewhacker. 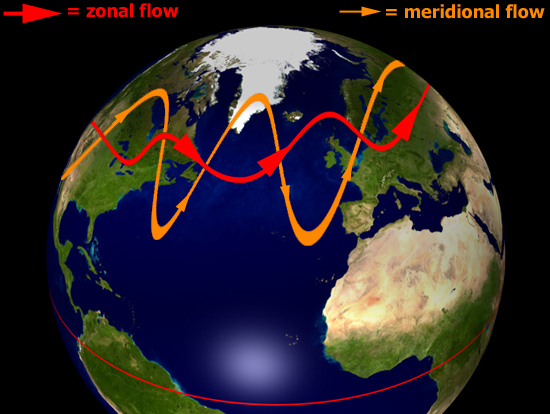 The Sun's weakening resonance has affected the Earth's stratopause, which is the boundary between the stratosphere and the mesosphere as the atmospheric pressure is 1/1000th of the atmospheric pressure at sea level. Within that atmosphere of rarified air, temperatures rise above freezing; and as the frozen moisture evaporates, it later falls ‘outside the reaction zone’ where the liquid moisture is super-cooled down to the point where microscopic ice crystals build. These ice crystals are called ‘Diamond Dust.’ Diamond dust are microscopic ice crystals about the width of a human hair. They have a hexagonal molecular structure. With less diamond dust (ice crystals) in the Earth's polar region the Arctic warms up which all that polar air does not like. So the polar air seeks to migrate out. Any of the ice crystals not flowing in the polar region Vortex collects into clumps and begins to migrate. Diamond dust that is not swept up by the Polar Vortex in the arctic tends to collect into clumps in the lower atmosphere at this region which falls into the jet stream to create high-pressure blocking systems. This is results in the 'Blob.' The trending to a strong meridional flow causes signs of atmospheric blocking with durations of either below-normal or above-normal temperatures. On the Pacific Northwest, that is the northeastern Pacific, the blocking results in the Blob. The polar jet stream has been undergoing changes since 2009-2010 and these trend patterns forces the wind flow increasingly from a zonal to a meridional pattern flow. 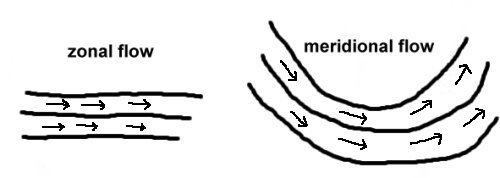 This is what you and everyone else are going to experience more often with the advent of global cooling. It will make forecasting even more difficult for conventional meteorologists and climatologists. However, I have been expecting this change for some time as I forecasted that it would happen with the transition to global cooling, so I am well-prepared to make forecasts with the new climate situation that is on tap for the next 30+ years. Anyway, the 'blob' is due to the enhanced high-pressure at the northeastern Pacific because of the split-flow of the jet stream that has been taking place at this region.  It is because of diamond dust in the Earth’s stratosphere – when it escapes outside the polar vortex – it helps to create blocking highs which alters the wind patterns of the jet streams from zonal flow to split-flow, then increasingly to meridional flow. And it is that meridional flow pattern which allows the jet stream to penetrate and transport polar air from high latitudes down into mid latitudes - closer to populations on the surface. Know that when upper level winds are parallel, or closely parallel to the lines of latitude then the wind pattern is ‘zonal.’ But when the winds cross the latitude lines at sharp angles, the wind patterns becomes ‘meridional.’ A meridional pattern with its highly curved flow generates more vorticity does zonal flow. The 'blob' comes by way of the persistent high pressure at this northeastern Pacific region. The high pressure is a sign of the increasingly gradual split-flow that results in weaker zonal flow winds with less mixing of the upper ocean waters, even as the surface ocean currents shift. |
|
|
|
Post by icefisher on Jan 17, 2017 16:26:12 GMT
The Big Dud!
|
|


