|
|
Post by missouriboy on Jan 14, 2018 13:51:09 GMT
www.ibtimes.co.uk/i-will-pay-fare-stephen-hawking-wants-send-climate-change-deniers-venus-1655075When Stephen Hawkins states the above when co2 has been historically much higher with no detriment to our existence, I can only think of this Sherlock Holmes quote "How often have I said to you that when you have eliminated the impossible, whatever remains, however improbable, must be the truth?" The improbable truth that remains is someone must've hacked his voice box thingy.....i mean, how would we ever know?  He's developing a Tennessee accent?  |
|
|
|
Post by missouriboy on Jan 14, 2018 14:16:42 GMT
The Differences Between Venus and EarthHere is a very short lecture from a faculty member at the University of Barcelona. Nicely summarized with an unknown level of bias and exclusion. Where is that new "planetary pressure and distance from sun(?) hypothesis" that was passed around here not so long ago? Pick it apart folks. www.am.ub.edu/~jmiralda/fsgw/lect6.htmlExtract - Why is Venus so hot today?The planet Venus has a temperature on its surface of 460 degrees Celsius, or about 800 degrees Fahrenheit. Venus is closer to the Sun than Earth, so you would think that would make it hotter. However, Venus also has a higher albedo than Earth, meaning that it reflects a lot more of the sunlight. Because of this higher albedo, Venus should actually be cooler than Earth if it had the same greenhouse effect. The reason Venus is so hot is because of its very large greenhouse effect. Almost all the atmosphere of Venus is carbon dioxide (96% of it). In addition, the total mass of Venus atmosphere is 100 times the mass of the atmosphere of Earth. At the surface of Venus, the pressure is 100 times the pressure at the Earth surface. The reason there is so much carbon dioxide in Venus' atmosphere is because that is where all the carbon in Venus is. Venus has no ocean, and no chemical weathering, and no subduction of carbonates into its mantle. Over its history, all the carbon in Venus's interior has been emitted by volcanoes and has stayed in the atmosphere. Earth and Venus actually have about the same amount of carbon, but they have it in different places. If one could take all the carbonate rocks in Earth's interior, vaporize them and emit all the carbon dioxide to the atmosphere, then Earth would become like Venus. We are lucky that over many millions of years, carbon dioxide has been constantly removed by dissolving in rainwater, combining with minerals in rocks, running through rivers to the ocean, sedimenting in the sea-floor, and then being subducted to the mantle!
|
|
|
|
Post by nautonnier on Jan 14, 2018 15:10:38 GMT
www.ibtimes.co.uk/i-will-pay-fare-stephen-hawking-wants-send-climate-change-deniers-venus-1655075When Stephen Hawkins states the above when co2 has been historically much higher with no detriment to our existence, I can only think of this Sherlock Holmes quote "How often have I said to you that when you have eliminated the impossible, whatever remains, however improbable, must be the truth?" The improbable truth that remains is someone must've hacked his voice box thingy.....i mean, how would we ever know? Just apply the Gas Laws to the atmosphere of these planets and presto the temperatures are correct. 'Green House Gas' Mickey Mouse science is not required. |
|
|
|
Post by sigurdur on Jan 15, 2018 13:34:02 GMT
|
|
|
|
Post by nautonnier on Jan 16, 2018 10:56:24 GMT
|
|
|
|
Post by Ratty on Jan 16, 2018 11:52:44 GMT
Where is the "Really like" button?  |
|
|
|
Post by missouriboy on Jan 16, 2018 16:56:29 GMT
How Do Climate Models Work?
|
|
|
|
Post by sigurdur on Jan 16, 2018 17:15:59 GMT
onlinelibrary.wiley.com/wol1/doi/10.1002/2017GL075604/abstractSomehow, the authors of this paper don't know about the long term hydro cycle in the Middle of North America. Now, it is because of..........oh............who the hell knows! This crap actually gets published! Both land-use changes and greenhouse gas (GHG) emissions have significantly modified regional climate over the last century. In the central United States, for example, observational data indicate that rainfall increased, surface air temperature decreased, and surface humidity increased during the summer over the course of the 20th century concurrently with increases in both agricultural production and global GHG emissions. However, the relative contributions of each of these forcings to the observed regional changes remain unclear. Results of both regional climate model simulations and observational analyses suggest that much of the observed rainfall increase – as well as the decrease in temperature and increase in humidity – is attributable to agricultural intensification in the central United States, with natural variability and GHG emissions playing secondary roles. Thus, we conclude that 20th-century land-use changes contributed more to forcing observed regional climate change during the summer in the central United States than increasing GHG emissions.
|
|
|
|
Post by sigurdur on Jan 16, 2018 18:44:00 GMT
www.atmos-chem-phys-discuss.net/acp-2017-1236/. Our climate is constrained by the balance between solar energy absorbed by the Earth and terrestrial energy radiated to space. This energy balance has been widely used to infer equilibrium climate sensitivity (ECS) from observations of 20th-century warming. Such estimates yield lower values than other methods and these have been influential in pushing down the consensus ECS range in recent assessments. Here we test the method using a 100-member ensemble of the MPI-ESM1.1 climate model simulations of the period 1850–2005 with known forcing. We calculate ECS in each ensemble member using energy balance, yielding values ranging from 2.1 to 3.9 K. The spread in the ensemble is related to the central hypothesis in the energy budget framework: that global average surface temperature anomalies are indicative of anomalies in outgoing energy (either of terrestrial origin or reflected solar energy). We find that assumption is not well supported over the historical temperature record in the model ensemble or more recent satellite observations. We find that framing energy balance in terms of 500-hPa tropical temperature better describes the planet's energy balance.
|
|
|
|
Post by Ratty on Jan 16, 2018 21:14:12 GMT
Any thought on this Nature paper? Has it been discussed before? On the causal structure between CO2 and global temperatureAbstractWe use a newly developed technique that is based on the information flow concept to investigate the causal structure between the global radiative forcing and the annual global mean surface temperature anomalies (GMTA) since 1850. Our study unambiguously shows one-way causality between the total Greenhouse Gases and GMTA. Specifically, it is confirmed that the former, especially CO2, are the main causal drivers of the recent warming. A significant but smaller information flow comes from aerosol direct and indirect forcing, and on short time periods, volcanic forcings. In contrast the causality contribution from natural forcings (solar irradiance and volcanic forcing) to the long term trend is not significant. The spatial explicit analysis reveals that the anthropogenic forcing fingerprint is significantly regionally varying in both hemispheres. On paleoclimate time scales, however, the cause-effect direction is reversed: temperature changes cause subsequent CO2/CH4 changes. |
|
|
|
Post by missouriboy on Jan 16, 2018 22:30:54 GMT
www.atmos-chem-phys-discuss.net/acp-2017-1236/. Our climate is constrained by the balance between solar energy absorbed by the Earth and terrestrial energy radiated to space. This energy balance has been widely used to infer equilibrium climate sensitivity (ECS) from observations of 20th-century warming. Such estimates yield lower values than other methods and these have been influential in pushing down the consensus ECS range in recent assessments. Here we test the method using a 100-member ensemble of the MPI-ESM1.1 climate model simulations of the period 1850–2005 with known forcing. We calculate ECS in each ensemble member using energy balance, yielding values ranging from 2.1 to 3.9 K. The spread in the ensemble is related to the central hypothesis in the energy budget framework: that global average surface temperature anomalies are indicative of anomalies in outgoing energy (either of terrestrial origin or reflected solar energy). We find that assumption is not well supported over the historical temperature record in the model ensemble or more recent satellite observations. We find that framing energy balance in terms of 500-hPa tropical temperature better describes the planet's energy balance. I went out and retrieved the monthly 500 hPA temperature anomaly data for 20 N to 20 S for 1979 to 2017. Here are the plots for Dec to Feb, and June-Aug. The curve is concave with a low point at about solar minimum between SC22 and SC23. Anomalies are highest in Dec-Feb post ENSO and variance is greater than June-Aug. Comments on what we are seeing here? 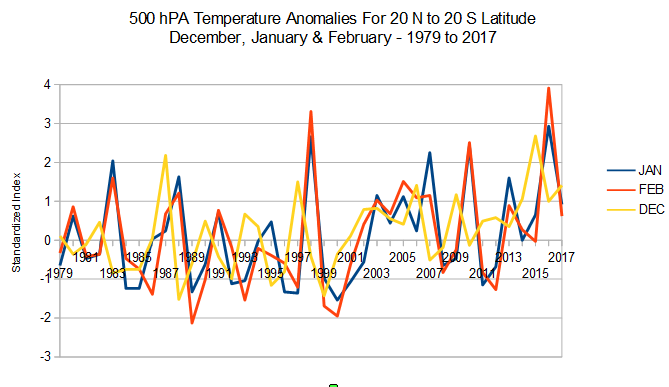 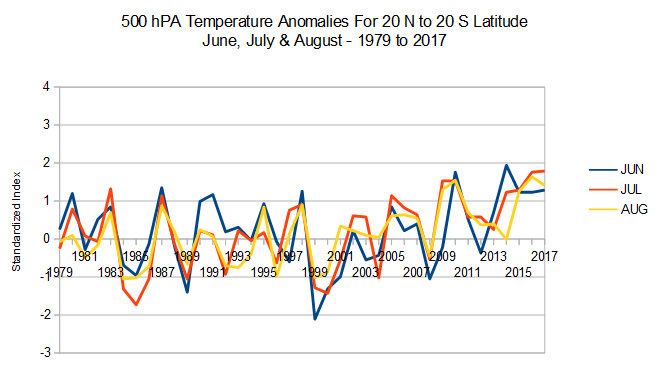 |
|
|
|
Post by nautonnier on Jan 16, 2018 23:48:39 GMT
Any thought on this Nature paper? Has it been discussed before? On the causal structure between CO2 and global temperatureAbstractWe use a newly developed technique that is based on the information flow concept to investigate the causal structure between the global radiative forcing and the annual global mean surface temperature anomalies (GMTA) since 1850. Our study unambiguously shows one-way causality between the total Greenhouse Gases and GMTA. Specifically, it is confirmed that the former, especially CO2, are the main causal drivers of the recent warming. A significant but smaller information flow comes from aerosol direct and indirect forcing, and on short time periods, volcanic forcings. In contrast the causality contribution from natural forcings (solar irradiance and volcanic forcing) to the long term trend is not significant. The spatial explicit analysis reveals that the anthropogenic forcing fingerprint is significantly regionally varying in both hemispheres. On paleoclimate time scales, however, the cause-effect direction is reversed: temperature changes cause subsequent CO2/CH4 changes. So how did the CO2 know that it was from anthropogenic sources and not just common or garden CO2 from natural sources? This dichotomy with most scientists would falsify the hypothesis that CO2 had a warming effect. But climate 'scientists' have severe confirmation bias and just cannot conceive of a falsification, so the gas laws altered in 1980 ..... |
|
|
|
Post by sigurdur on Jan 17, 2018 2:34:10 GMT
www.atmos-chem-phys-discuss.net/acp-2017-1236/. Our climate is constrained by the balance between solar energy absorbed by the Earth and terrestrial energy radiated to space. This energy balance has been widely used to infer equilibrium climate sensitivity (ECS) from observations of 20th-century warming. Such estimates yield lower values than other methods and these have been influential in pushing down the consensus ECS range in recent assessments. Here we test the method using a 100-member ensemble of the MPI-ESM1.1 climate model simulations of the period 1850–2005 with known forcing. We calculate ECS in each ensemble member using energy balance, yielding values ranging from 2.1 to 3.9 K. The spread in the ensemble is related to the central hypothesis in the energy budget framework: that global average surface temperature anomalies are indicative of anomalies in outgoing energy (either of terrestrial origin or reflected solar energy). We find that assumption is not well supported over the historical temperature record in the model ensemble or more recent satellite observations. We find that framing energy balance in terms of 500-hPa tropical temperature better describes the planet's energy balance. I went out and retrieved the monthly 500 hPA temperature anomaly data for 20 N to 20 S for 1979 to 2017. Here are the plots for Dec to Feb, and June-Aug. The curve is concave with a low point at about solar minimum between SC22 and SC23. Anomalies are highest in Dec-Feb post ENSO and variance is greater than June-Aug. Comments on what we are seeing here? Question to me, which will require a bit of research unless someone knows it off the tip of their hat? Variation, by season, with temperature. 20N-20S should NOT vary this much? There is an orbital factor at play....yes. Perihelion/aphelion. Thinking....thinking.... Missouri: Can you overlay the graphs? Bold colors for each? No, scratch that. I may have to try and print these out. There is something here.....isn't there? |
|
|
|
Post by sigurdur on Jan 17, 2018 5:21:13 GMT
|
|
|
|
Post by sigurdur on Jan 17, 2018 13:46:58 GMT
|
|


