|
|
Post by sigurdur on Mar 25, 2016 21:54:14 GMT
Missouriboy: As I was reading the WUWT post, my mind was reeling a bit. But I plowed on, started reading the comments. It is very important to read the comments, as what the author was writing has some basic errors in it. |
|
|
|
Post by missouriboy on Mar 25, 2016 23:09:50 GMT
Missouriboy: As I was reading the WUWT post, my mind was reeling a bit. But I plowed on, started reading the comments. It is very important to read the comments, as what the author was writing has some basic errors in it. Actually, that's one of the reasons I posted it. Didn't digest everything, but the repartee seemed interesting and not being an expert in this, the online referee comments are very helpful. One thing I've always liked about WUWT, is the trash talk is minimal. |
|
|
|
Post by Ratty on Mar 26, 2016 0:11:49 GMT
Ok, code knows how to do this, I will have to find out from him again. It is tricky but can be done. Not exactly sure what's needed but Dropbox is a possibility for sharing large files ... I think. |
|
|
|
Post by sigurdur on Mar 26, 2016 0:35:23 GMT
Ok, code knows how to do this, I will have to find out from him again. It is tricky but can be done. Not exactly sure what's needed but Dropbox is a possibility for sharing large files ... I think. That would work RATTY! What were you in a previous time, a computer guy or something?  Then it would only require a link! GREAT THINKING! |
|
|
|
Post by missouriboy on Apr 7, 2016 23:22:23 GMT
DOES THIS CHART SHOW DECLINE IN UV RADIATION AT SOLAR MINIMUM (SC23-SC24)
Perhaps I'm stretching. But, does this chart show differential decline in deep-penetrating UV radiation during the SC23-SC24 solar minimum? I compiled ocean temperature deviations by month between 15 N and 15 S latitude for depths between 0 and 100 meters and overlaid it with SST mean temperature deviations and IR low cloud cover deviations (shown in the chart with which I opened this thread). Solar minimum occurred during 2007-2008. Note that peak SST temperatures not only occur as cloud cover declines, but decrease by 0.2 C going into 2008. At 0 to 100 meters, temperature peaks lag SST peaks slightly, but show increasing temperature deviations from SST as you progress downward to solar minimum: 0.3C 2004-5, 0.4C 2006, 0.5C 2007, 0.6C 2008 0.4C 2009. This could be what I would expect if UV declines at solar minimum. Maximum cloud cover does not appear to change much between 2004 and 2007. although it does in 2008, which, in itself, is interesting if it is not a coincidence. Comments? 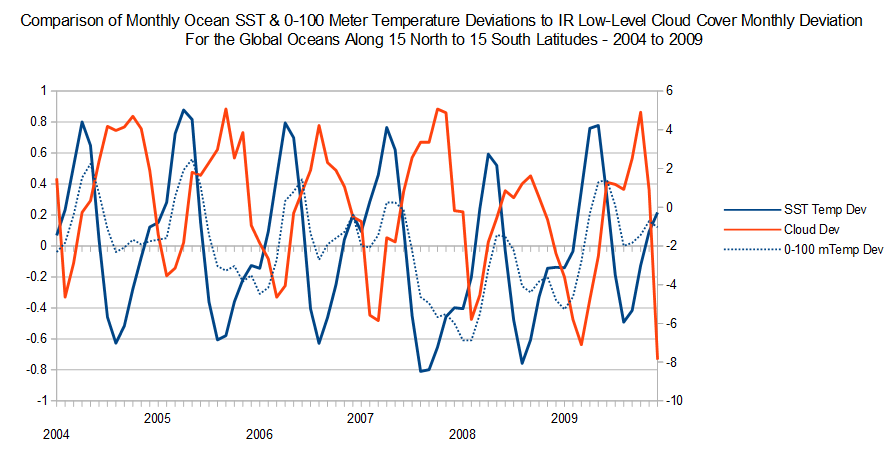
|
|
|
|
Post by acidohm on Apr 8, 2016 9:16:22 GMT
Fantastic study Missouriboy!! It is a shame the cloud data doesn't extend further. ..however I'm very pleased to see graphic evidence that uv may have an effect on sst.
I've said it before, when I first found out the sun had cycles, very quickly through Internet pottering i concluded uv should be prime suspect for a cold period we experienced in the uk from 2008-2012 or so.
Hot days on a beach quickly show that something warms water quickly and hey! Why am I all red!!!!
The connection to Cloud cover though is a deeper insight then I managed however, good job.
|
|
|
|
Post by missouriboy on May 22, 2016 22:01:00 GMT
Ran across this on the ISCCP cloud site ... seasonal cloud amount by latitude over time. The decline in cloud cover from about 15 to 30 N latitude since 1993 is interesting. I have not yet found the raw figures for this however. Possibly a very large increase in solar heating across the north sub-tropical ocean during that time? There is some minor replication of this at the same latitudes in the southern hemisphere. Perhaps Graywolf could give us a proximal value of what this might equate to with his insolation charts and how these might compare to the temperature changes we've seen in the surface ocean layers over this time period. isccp.giss.nasa.gov/climanal3.html |
|
|
|
Post by missouriboy on May 22, 2016 22:20:40 GMT
This was another chart I had worked up at the time that we had our posting problems, and I forgot about it. Note the differences in the VIS-IR and IR cloud cover when plotted against the geomagnetic index. Particularly vexing is the large change in the VIS-IR cover during the geomagnetic peak of solar cycle 22, which is not replicated during the same period of solar cycle 23 Remembering that the AP peak occurs after the sunspot peak in a solar cycle. Personally not a clue as to why that should happen. These two are separated by the rather dramatic decline in low-level cloud cover that occurred after the 1997 El NINO. The downward trend in each of the three indexes is indicated. These declined by 5 to 8 percentage cover points over the 26-year period. A similar temperature increase in the SST would amount to about 1 to 2 C. 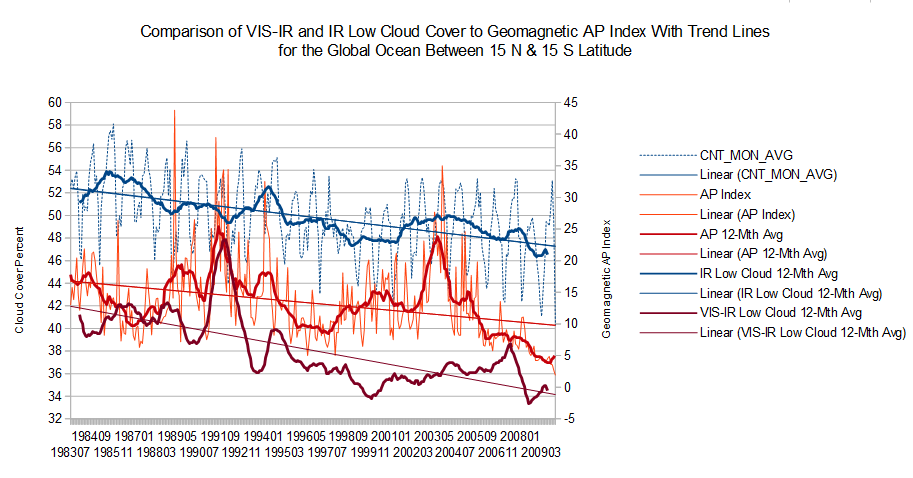 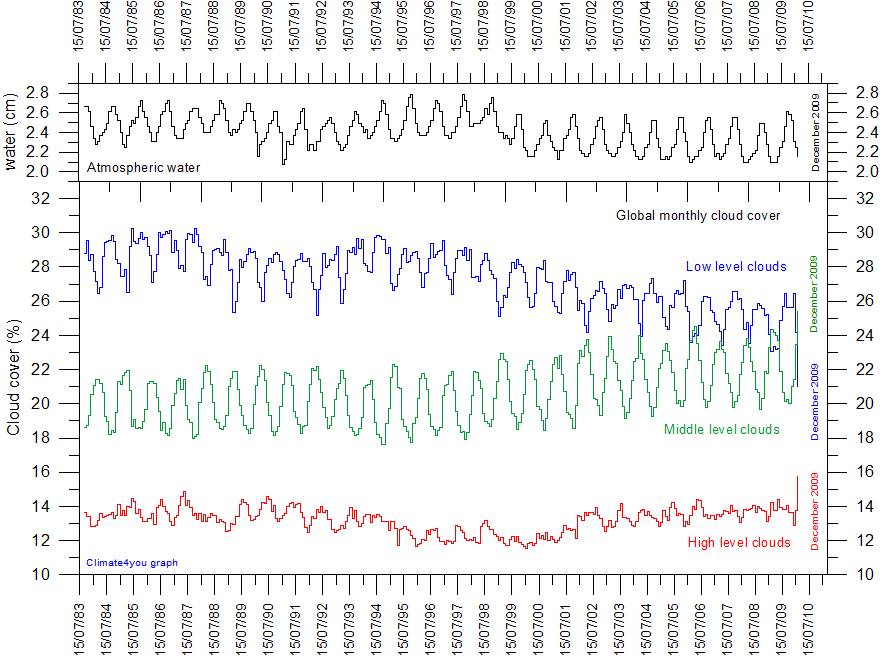 |
|
|
|
Post by nonentropic on May 22, 2016 22:34:45 GMT
Atmospheric water quantity falling wow. How?
All I can say is that looking for climate signals using a static interpretation method will never work.
The cloud shifts from low to high so where is the energy absorbed and radiated as a consequence. and how would the measuring method miss or overestimate the climatic temperature status.
It may in fact be much worse or much better than we thought.
|
|
|
|
Post by missouriboy on May 22, 2016 22:36:46 GMT
I am re-posting the albedo chart here so I will remember where to find it. Since the cloud cover data is not available since the end of 2009, we must speculate what the higher albedo since 2010 is due to and where. I am assuming that clouds would be a significant proportion. 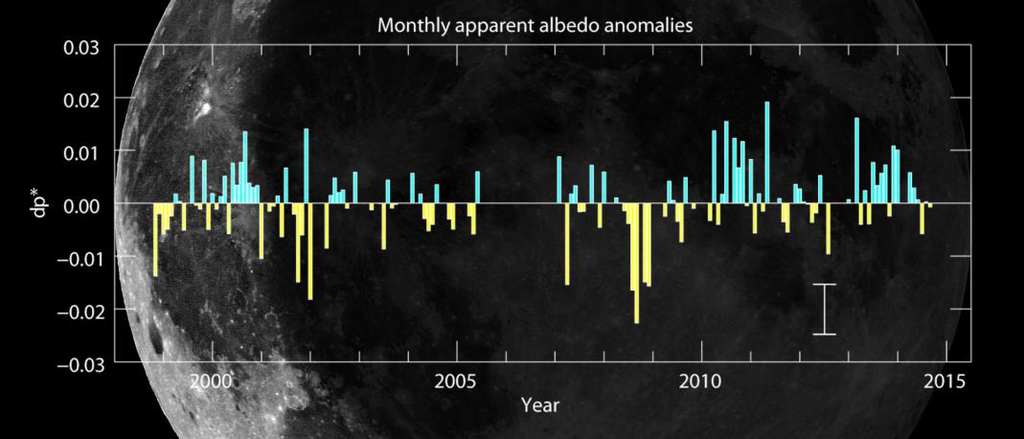 |
|
|
|
Post by missouriboy on May 22, 2016 22:39:04 GMT
Atmospheric water quantity falling wow. How? All I can say is that looking for climate signals using a static interpretation method will never work. The cloud shifts from low to high so where is the energy absorbed and radiated as a consequence. and how would the measuring method miss or overestimate the climatic temperature status. It may in fact be much worse or much better than we thought. I am operating on a NASA (?) quote that lower-level clouds reflect more solar energy than higher-level clouds. And the shift, coming as it did, quickly following a major El Nino, suggests a major change for which we have not a clue as to cause. |
|
|
|
Post by Ratty on May 22, 2016 23:47:45 GMT
[ Snip ] And the shift, coming as it did, quickly following a major El Nino, suggests a major change for which we have not a clue as to cause. Add one more to the list. |
|
|
|
Post by sigurdur on May 23, 2016 0:31:38 GMT
The lower AH of the atmosphere has been written about by a scientist from Texas. His published paper missed the IPCC5 publishing deadline. His findings didn't agree with GCM models so there was resistance to including his paper as a late entry into the WG- TAR area of the IPCC5 papers.
|
|
|
|
Post by nautonnier on May 28, 2016 9:15:09 GMT
Atmospheric water quantity falling wow. How? All I can say is that looking for climate signals using a static interpretation method will never work. The cloud shifts from low to high so where is the energy absorbed and radiated as a consequence. and how would the measuring method miss or overestimate the climatic temperature status. It may in fact be much worse or much better than we thought. If atmospheric water is falling then enthalpy is falling which means for the same amount of heat (kilojoules per kilogram) the temperature will be higher. If that falling humidity is correct especially at altitudes below the freezing level then that alone could explain the few hundredths of a degree rise in temperatures - which is the incorrect metric for heat content. |
|
|
|
Post by neilhamp on May 28, 2016 17:55:54 GMT
|
|


