|
|
Post by missouriboy on Jan 13, 2019 19:19:55 GMT
Since we are again talking about volcanic activity and its effects on weather, I started going back through past material on the Tambora. WattsUpWithThat
wattsupwiththat.com/2016/06/05/summer-of-1816-in-new-hampshire-a-tale-of-two-freezes/wattsupwiththat.com/2012/04/15/missing-the-missing-summer/From Wiki (for what it's worth)en.wikipedia.org/wiki/Year_Without_a_SummerInteresting how it is warmer in Eastern Europe. Indicative of longitudinal atmospheric flow? 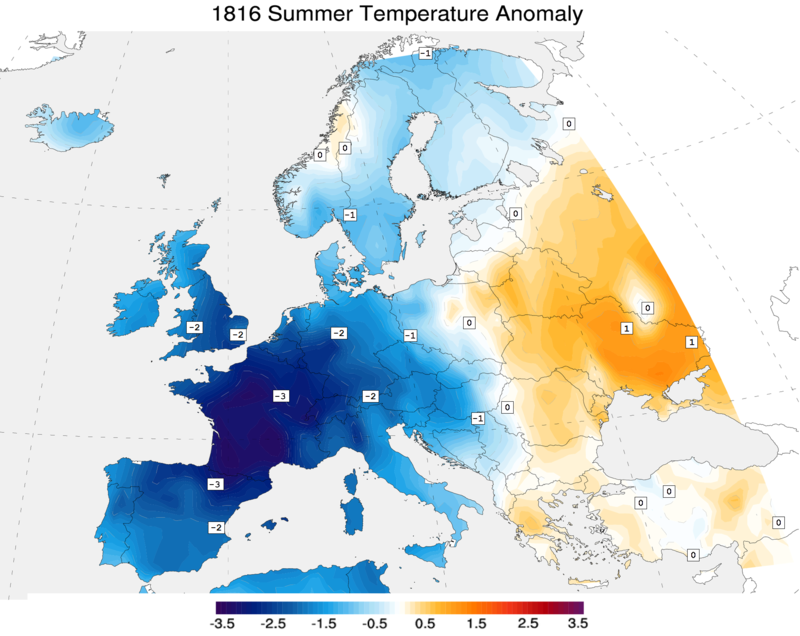 From the Central England (CET) and Franklin Institute Temperature Records From the Central England (CET) and Franklin Institute Temperature RecordsThere is a distinct "hit" to summer temperatures in Philadelphia on the order of 2.5 to 3 C during the summer following the Tambora eruption... less so in Central England, perhaps on the order of 1 C or so. This may show the true tempering effect of the Gulf Stream. The graph also shows that the Dalton Minimum was already affecting temperatures prior to Tambora's eruption. Winter temperatures do not show any particularly discernible effect from Tambora. As pointed out by first article referenced from Watts, the most serious effects on agriculture were the unseasonable frosts that occurred during the 1816 growing season (at least in New England). 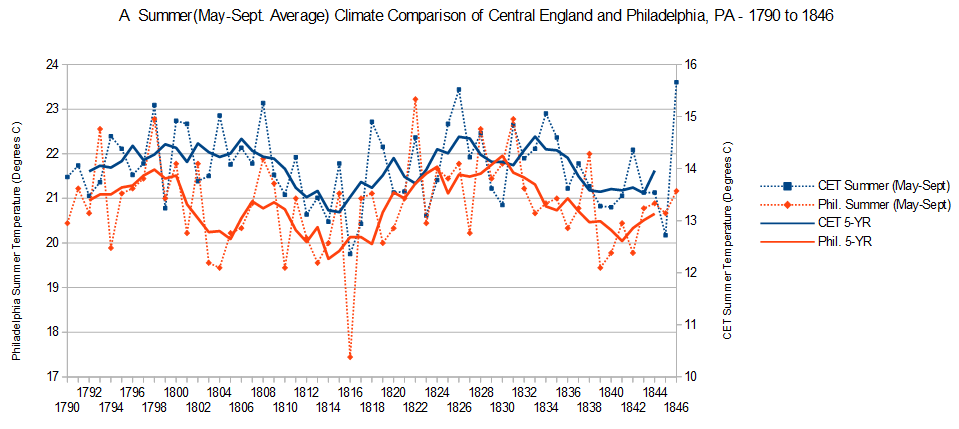 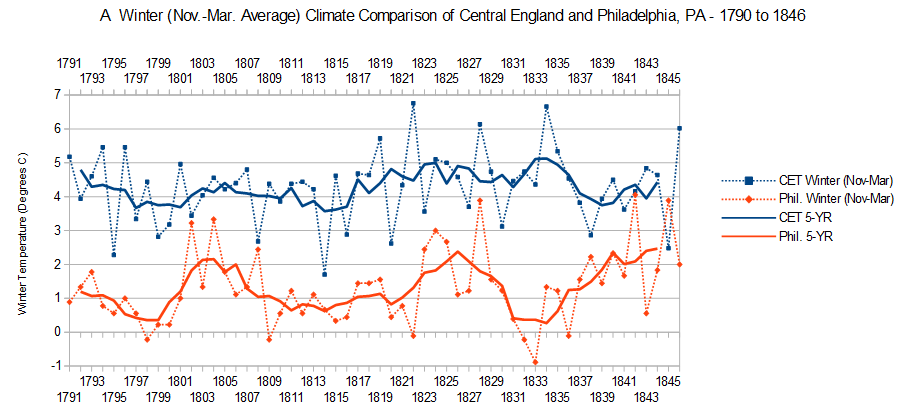 |
|
|
|
Post by missouriboy on Jan 17, 2019 21:39:03 GMT
|
|
|
|
Post by missouriboy on Jan 25, 2019 6:33:23 GMT
|
|
|
|
Post by Ratty on Jan 25, 2019 12:11:43 GMT
|
|
|
|
Post by blustnmtn on Jan 25, 2019 15:20:27 GMT
The “Ring of Fire” has been quite active lately. The big exception has been the west coast of North America. Rumblings under Mt. St.Helens and small quakes but no catastrophic event. If there is a link between seismic activity and solar minimum, there’s still a lot of time for the west coast to be impacted. I hope for small events but big ones are inevitable and nobody is prepared for them. |
|
|
|
Post by nautonnier on Jan 25, 2019 15:48:54 GMT
The “Ring of Fire” has been quite active lately. The big exception has been the west coast of North America. Rumblings under Mt. St.Helens and small quakes but no catastrophic event. If there is a link between seismic activity and solar minimum, there’s still a lot of time for the west coast to be impacted. I hope for small events but big ones are inevitable and nobody is prepared for them. Indeed. If Mt Rainier did a Mt St Helens it would be disastrous for several industry leading companies. |
|
|
|
Post by blustnmtn on Jan 25, 2019 16:25:36 GMT
The “Ring of Fire” has been quite active lately. The big exception has been the west coast of North America. Rumblings under Mt. St.Helens and small quakes but no catastrophic event. If there is a link between seismic activity and solar minimum, there’s still a lot of time for the west coast to be impacted. I hope for small events but big ones are inevitable and nobody is prepared for them. Indeed. If Mt Rainier did a Mt St Helens it would be disastrous for several industry leading companies. Mt. Shasta would also be interesting. However, the Cascadia Subduction Zone is the sleeping monster that will alter American history...someday. |
|
|
|
Post by missouriboy on Jan 25, 2019 17:34:24 GMT
Like Bond's martini ... shaken, not stirred. |
|
|
|
Post by blustnmtn on Jan 27, 2019 14:15:01 GMT
|
|
|
|
Post by missouriboy on Jan 27, 2019 15:13:21 GMT
Yes, and aren't we all really pleased that the science is so thoroughly settled. So much so in fact that the cult must constantly reach out for mesmerizing incantations to hide the fails. But Tambora (or some coincidence) does appear to show up in the CET summer records, and more dramatically in the Philadelphia summer record ... as shown in a previous post on this thread. And it shows up in the next summer (1816), not the same year. Must look further at his data, which I don't have. But I would like to ...  |
|
|
|
Post by blustnmtn on Jan 27, 2019 16:28:06 GMT
Yes, and aren't we all really pleased that the science is so thoroughly settled. So much so in fact that the cult must constantly reach out for mesmerizing incantations to hide the fails. But Tambora (or some coincidence) does appear to show up in the CET summer records, and more dramatically in the Philadelphia summer record ... as shown in a previous post on this thread. And it shows up in the next summer (1816), not the same year. Must look further at his data, which I don't have. But I would like to ... That’s why I said interesting. I’ve always believed that the cooling effects of aerosols from large volcanic eruptions (Pinatubo) were easily seen in the temperature data. There’s something curious here. How could this temperature data miss the Tambora eruption signature? The data goes ~5 years past the event. |
|
|
|
Post by missouriboy on Jan 27, 2019 18:35:41 GMT
Yes, and aren't we all really pleased that the science is so thoroughly settled. So much so in fact that the cult must constantly reach out for mesmerizing incantations to hide the fails. But Tambora (or some coincidence) does appear to show up in the CET summer records, and more dramatically in the Philadelphia summer record ... as shown in a previous post on this thread. And it shows up in the next summer (1816), not the same year. Must look further at his data, which I don't have. But I would like to ... That’s why I said interesting. I’ve always believed that the cooling effects of aerosols from large volcanic eruptions (Pinatubo) were easily seen in the temperature data. There’s something curious here. How could this temperature data miss the Tambora eruption signature? The data goes ~5 years past the event. If you look at his chart, there does appear to be an abnormal summer downturn in mid-year 1816 where his blue line is almost 2 std dev below the mean ... that appears larger than any other summer. I looked at his source data, and its not immediately clear which his 42 stations are sourced from. The copies I tested yielded no dates that old. I really want those records but am not looking forward to manually copying (highlight and paste into spread sheet) without knowing which yields the long records (sigh). Probably the ones that are labeled as needing permission to access. What was the lag on Pinatubo from explosion to primary effect? Any quick recollection? 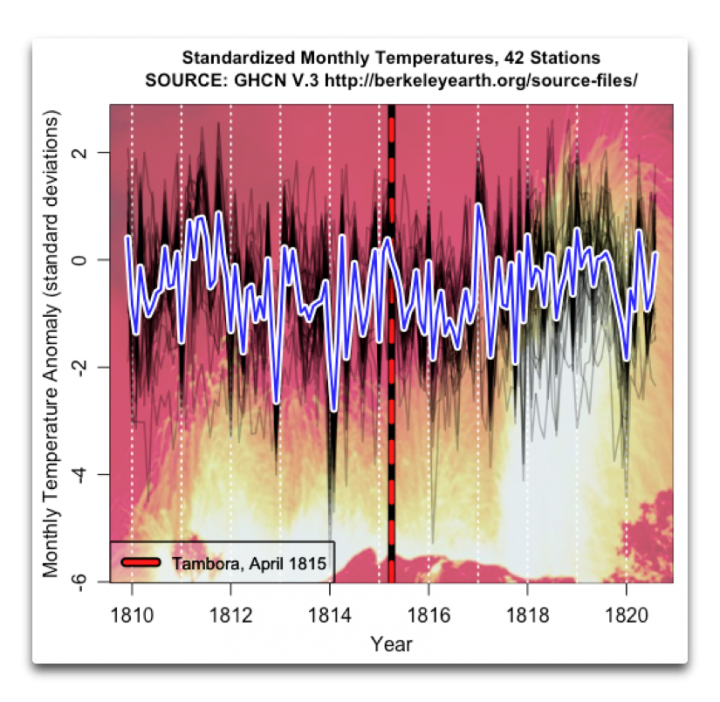 |
|
|
|
Post by blustnmtn on Jan 27, 2019 19:57:36 GMT
That’s why I said interesting. I’ve always believed that the cooling effects of aerosols from large volcanic eruptions (Pinatubo) were easily seen in the temperature data. There’s something curious here. How could this temperature data miss the Tambora eruption signature? The data goes ~5 years past the event. If you look at his chart, there does appear to be an abnormal summer downturn in mid-year 1816 where his blue line is almost 2 std dev below the mean ... that appears larger than any other summer. I looked at his source data, and its not immediately clear which his 42 stations are sourced from. The copies I tested yielded no dates that old. I really want those records but am not looking forward to manually copying (highlight and paste into spread sheet) without knowing which yields the long records (sigh). Probably the ones that are labeled as needing permission to access. What was the lag on Pinatubo from explosion to primary effect? Any quick recollection Dubious source but it looks fairly immediate and long lived (years). www.giss.nasa.gov/research/briefs/hansen_02/ |
|
|
|
Post by missouriboy on Jan 28, 2019 3:05:45 GMT
That'a about the same time frame as Philadelphia temp effects from Tambora. So Tambora effect 15 months later was -2.5 C (approx) and Central England -1.2 C ... and Pinatubo was -0.6 C for the lower(?) troposphere. I was in Arizona (7000 ft.) in 1992 and don't really remember anything dramatic.   Comparison of predicted (solid line) and observed (dashed line) global tropospheric temperatures. |
|
|
|
Post by fatjohn1408 on Feb 11, 2019 10:55:00 GMT
That'a about the same time frame as Philadelphia temp effects from Tambora. So Tambora effect 15 months later was -2.5 C (approx) and Central England -1.2 C ... and Pinatubo was -0.6 C for the lower(?) troposphere. I was in Arizona (7000 ft.) in 1992 and don't really remember anything dramatic. Comparison of predicted (solid line) and observed (dashed line) global tropospheric temperatures. This study seems to indicate that the tambora event was preceded by high el nino activity maybe dampening its mark on the temperature data? journals.ametsoc.org/doi/pdf/10.1175/2007JCLI1830.1 |
|


