|
|
Post by glennkoks on Aug 27, 2016 16:03:18 GMT
According to the fine folks at NASA we have warmed about .8 C since 1880. But two thirds of that warming has come since 1975. If this is in fact true one can conclude that if we have warmed a little over .5C over the last 40 years. I don't buy into all the AGW paranoia but some of that .5 degree warming may be due to mans activity here on earth and the rest is natural variation. So if we have warmed about .5 we could certainly cool by that same amount over roughly the same time. Therefore considering the low solar activity and multidecadal oscillations I don't think 1.0 to 1.5 degrees of cooling would be that far of a stretch. Were pretty smart and their have been lots of agricultural advances since 1880 so I don't suspect that .8 to 1.0 degree of cooling would be all that catastrophic. Pretty much take us back to where we were in the late eighteen hundreds. You start going cooler than that say 1.0 to 1.5 degrees and I suspect our ability to feed our population becomes compromised. earthobservatory.nasa.gov/Features/WorldOfChange/decadaltemp.php |
|
|
|
Post by acidohm on Aug 27, 2016 17:26:48 GMT
Our contribution to global co2 is 5% which is 0.04% of the atmosphere....I struggle to find our fault in 0.5°c rise in adjusted temperatures....
Just sayin....
|
|
|
|
Post by missouriboy on Aug 28, 2016 8:22:14 GMT
Here’s one way of arriving at my estimate of a less than 0.2C cooling effect from Cycle 24/25. Please note that I am looking at climate effects of 20 years or more, not shorter ENSO-type effects or even shorter 1 year effects. Here’s the plot of historical average annual sunspot Groups from Svalgaard, et al. 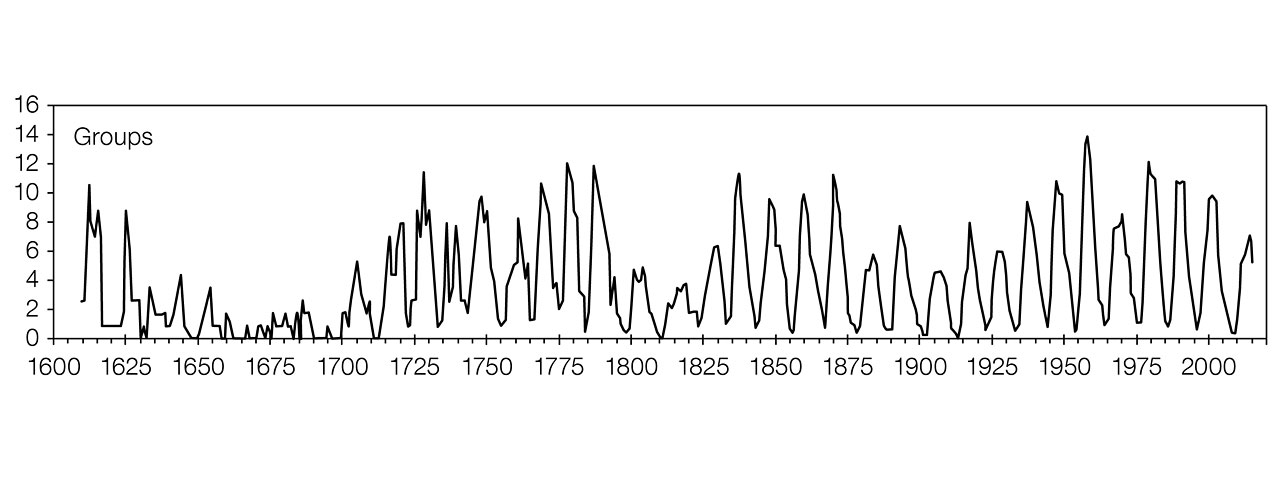 By looking at the chart above, one can see that the Cycle 24/Cycle 25 sunspot activity if Cycle 25 is similar to Cycle 24 as Svalgaard predicts would mean that the solar activity over these 2 cycles would be about twice as high it was during the Dalton Minimum in the 1800-1825 period. How much cooling was there in 1800-1825? The global temperature numbers from that period are not known, but there is a good record of the Central England Temperatures and the temperatures do show similar warming to the Hadcrut global temperatures during the period they are available from 1850 –about 0.8C. Here is the Central England Temperature (CET) record.  The temperature record clearly shows some cooling in the 1800-1825 Dalton Minimum period. But there are 3 similar cool periods in in the years before and after the Dalton Minimum period - the 1780’s, around 1840 and 1880’s. I’d encourage you to make your own guess as to how much of the cooling during the 25 or so years of the Dalton Minimum was actually caused by the less active sun. And then, if you believe Svalgaard's prediction, the Cycle 24/25 solar activity will likely be about twice that of the Dalton Minimum meaning there perhaps would be only half the Dalton Minimum cooling. But before you do that here is another factor worth noting. What was possibly the largest volcanic eruption in the last 2000 years occurred during the Dalton Minimum. Mt Tambora erupted and hurled some 10 cubic miles of material into the atmosphere in 1815, and 1816 was known as the “Year without a summer”. en.wikipedia.org/wiki/1815_eruption_of_Mount_TamboraThere's little doubt that the coolest years during the Dalton Minimum were largely due to the Tambora eruption. My guess is that the Dalton Minimum had less than a 0.4C global cooling effect versus the average temperatures of the time averaged over 20 years and based on that, Cycle24/25 should have less than half that effect or less than 0.2C. The sunspot group-number chart you posted shows SC24 to be slightly larger relationaly to other cycles than smoothed sunspot numbers. The chart below compares smoothed sunspot numbers for SCs 22, 23 and 24 to SCs 3 to 6. So far, they appear to be generally the same size. So, if SC 25 turns out to be the same size as 24, the two four-cycle series might well end up being twins (or very close). 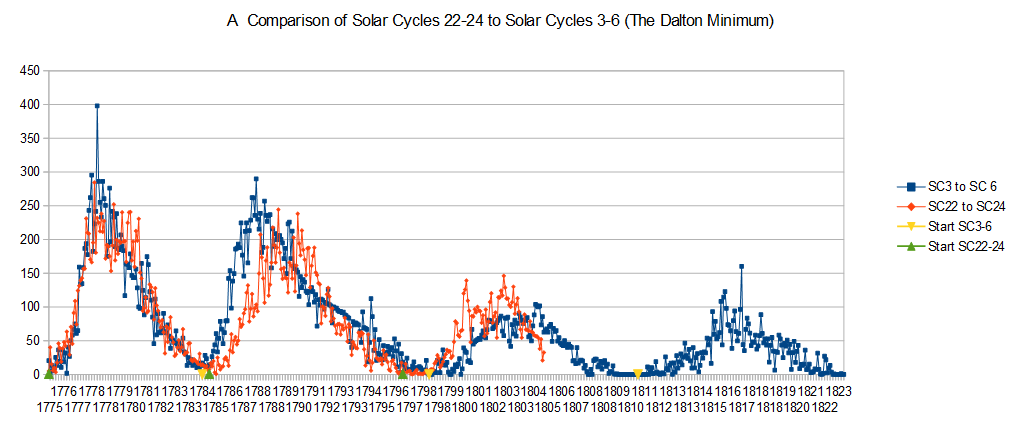 There are also other ways to compare Solar cycles. Sunspots have merely been used as one proxy. A simple running summation over 131 months (the average solar cycle length since SC1) gives a good indication of strength over a sliding 11-year time period. This measure using both sunspot numbers and the geomagnetic index indicate that SC24 has now dropped below that of SCs 12-14 (1878-1913) which was the next closest one to the Dalton. You may remember that this period, particularly the early parts, contained some very brutal winters in the mid-to-upper great plains ... and in Europe too if I remember correctly. SC24 is still about 4 years from closeout, so these summed values should go somewhat lower. The three solar cycles from 1878 to 1913 consisted of two weak cycles (12 and 14) separated by a larger one (13). Krakatoa also blew in 1883 at solar max. Strange how these volcanic events seem to occur during weak solar cycles. Notice that the AP Index 11-year summation shows high values in the 1915-40 period which you do not get with sunspots alone. The slopes on the AP tend to be very sharp and long. Also note the high spike in AP activity which may have modified the harsh conditions of SCs 12 and 14 with a break between 1890-1900. In comparison, the one-cycle downturn from 1964 to 1976 was very small regardless of the measure you look at. Using the AP Index, SC24 has only been half the strength of SC20. 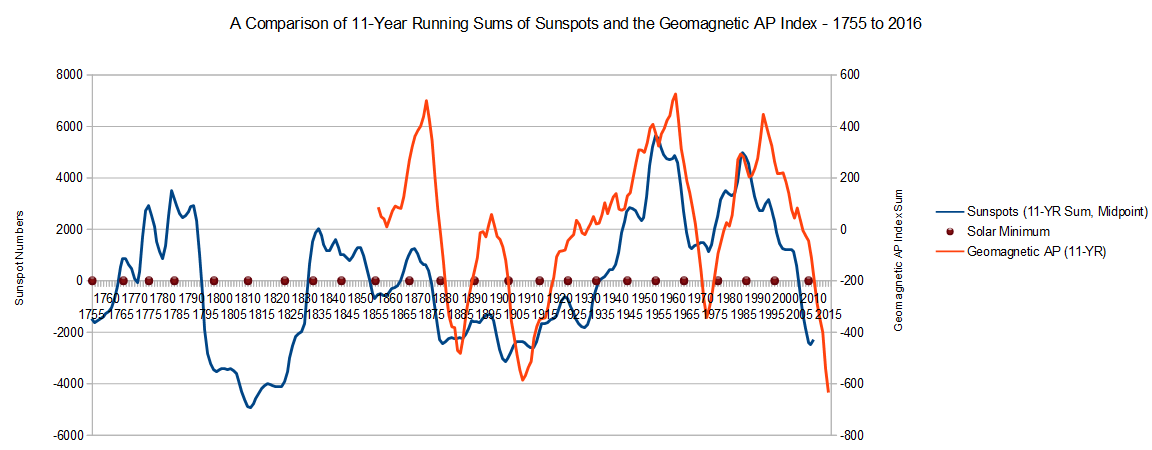 So What Effects Will SC 24 and 25 likely have? So What Effects Will SC 24 and 25 likely have? Since I'm no better than anyone else when it comes to SWAG, I'm forced to look to the best of our data bases and employ the Joe Bastardi approach of looking for analog time periods. For the moment I'm going to limit myself to using the Central England temperature (CET) data base together with the HADSST3 sea surface temperature deviations and the time series analysis that I have worked on for the mid-upper great plains. The world will have to wait. The next two charts show the CET temperature deviations from a 1961-90 normal back to 1659 ... over-plotted with the HADSST3 deviations and 11-year running summations of sunspots (chart 1) and the AP Index (chart 2). As you would expect, CET tracks
the N Atlantic (40-65N) very closely. The deep declines in the 3-year avg. CET probably reflect those periods when more of the
weather is coming from the north and east, versus off the warmer ocean. If solar conditions return to those that prevailed in 1876-90,
then based on what happened then might be a reasonable proxy for what could happen now. Will SSTs lag on the decline? Don't know
... but they've already fallen by between 0,5 and 0.8 C. The total temperature difference between 1876 and 2005 is about 2 C. Will it
return that far? That is a VERY sharp drop for a temperate climate like England. But it was there before ... what will stop it now?
Chart 3 shows the upper grain belt recording stations mean ( 44-50 N) over-plotted with the CET and the N Atlantic. Interestingly, it
too, seems to trend along the same curve as the CET and N Atlantic although it has much larger variances. While the CET has variances approaching 1 C in a 3-year moving average, the grain belt stations have a variance of more like 3 C. A CET decline of 1 tp 1.5 C does not look unreasonable under these assumptions and conditions. N Atlantic SSTs (and deeper) have already fallen by 0.5 C or more ... so, if the total decline was held to -1 C, that would be a break.. I will update these as I give more thought to it. It's getting late here and I'm tired. 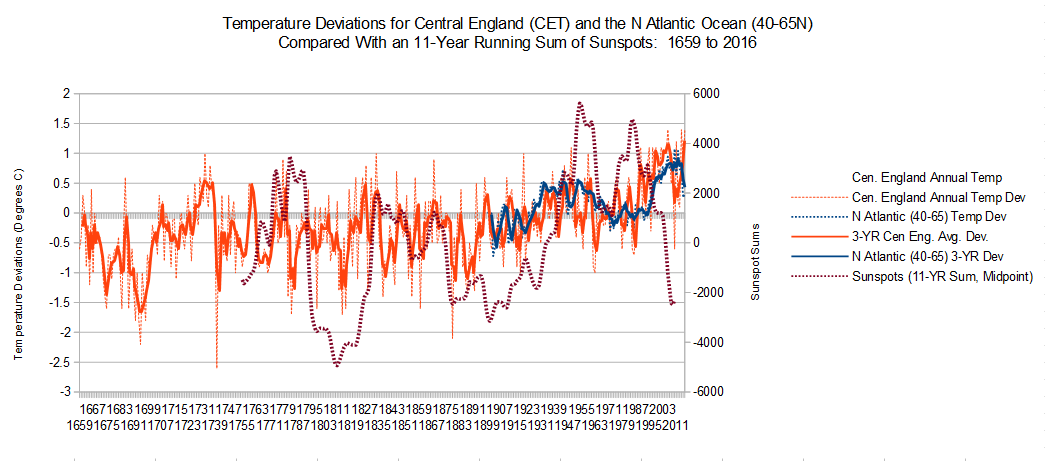 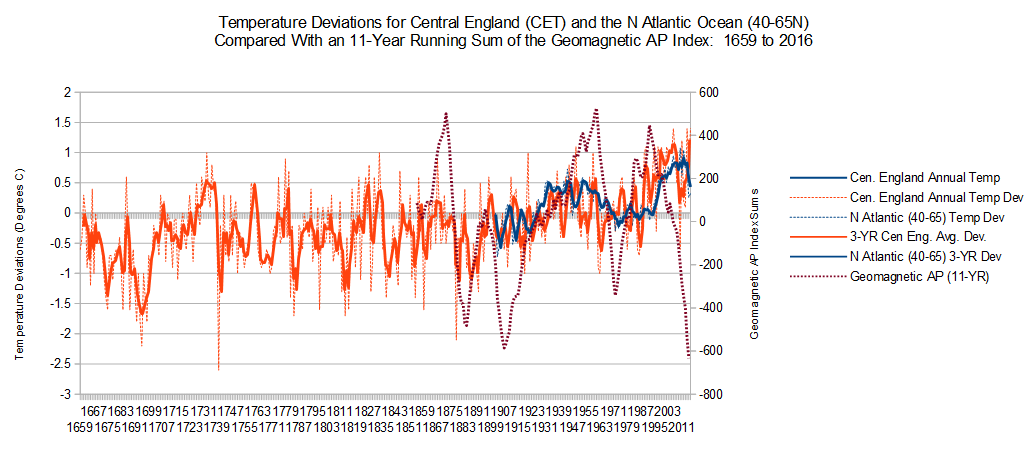 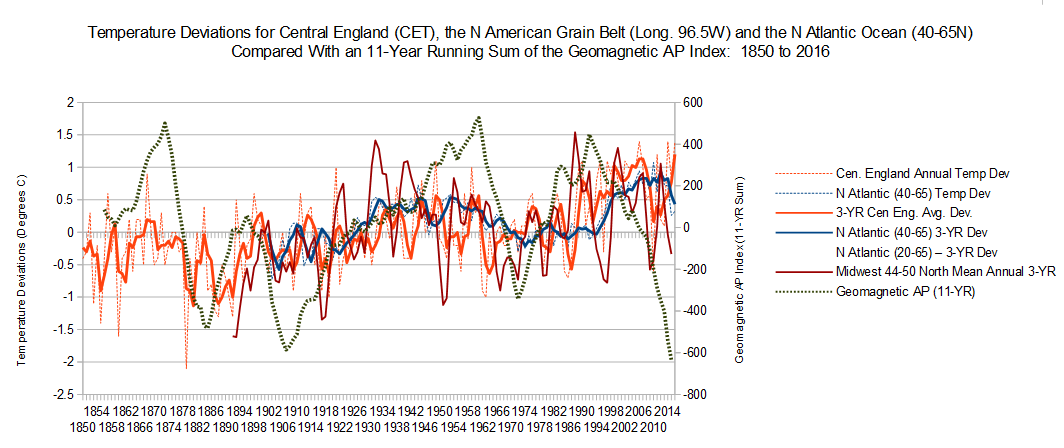 |
|
|
|
Post by duwayne on Aug 28, 2016 20:58:16 GMT
Missouriboy, thanks for sharing your thoughts on this subject and I appreciate the input above from others as well.
One of your points is that the solar activity drop during Cycles 24 and 25 may come closer to that of the Dalton Minimum than I concluded in my earlier post. That will be interesting to follow although I'm not even sure what metric should be used to measure Solar activity.
You indicate a belief that we could see temperature drops of 1.5C or so in selected areas such as the Grain Belt of the US in the next several years.
As Sigurdur has stated global temperatures have stayed pretty steady if measured over periods of 20 years or more. Someone might want to check my numbers on this but when I look at the Hadcrut4 anomalies back to 1850, the largest drop in any single year's annual temperature from the average of the previous 20 years is 0.2C. This is partly because there has been a long term uptrend in global temperatures over that time frame. But for some of the time since 1850 the cool phase of the Ocean Current Cycle with its La Ninas and cool AMO and PDO's has been in effect and even with that assistance in canceling out the GHG uptrend during those periods, there’s been no larger drop in any year than 0.2C versus the previous 20-year average.
Remember this 0.2C drop is for the single biggest year. For multi-year periods the drop is reduced.
Now if you throw in a Dalton Minimum and volcanic eruption or 2 you could see a drop in global temperatures of more than 0.2C over a year or more. The odds of this happening are increased because we are in the cooling portion of the Ocean Current cycle. But measured over a 20-year period, or for my purposes a 30-year period with no major volcanic action, well, we’ll see.
On the other hand multi-month regional temperature drops of 1 degree or more are common. A strong La Nina in areas of the Pacific is an example along with the areas you cite in your post.
|
|
|
|
Post by missouriboy on Aug 29, 2016 2:30:27 GMT
The solar drop over 24 has not been that big and the cycle is over, so if 25 stays close to 24 it will turn into a meh event. I don't see the cold. While I have not attempted to set up the problem and do the math, I see this as an input/output balance problem. For 70 years the oceans have been absorbing more energy than they have been releasing as a result of energetic solar cycles. IF a less-energetic solar cycle results in a situation where energy reaching and being absorbed by the surface is less than the amount of energy being released to the atmosphere, then the battery is being drained day after day, year after year. If the following solar cycle is the same, then the drain on the battery continues. And temperature continues downward. In this way the drain on the energy balance in the system continues until input again exceeds output. We just don't know where that balance is. Our ignorance has preceded us. If we're not not careful, we will have to hire a climate priest to solve our problem.  Perhaps I am missing something.  |
|
|
|
Post by fredzl4dh on Aug 29, 2016 2:32:34 GMT
Found this F B page quite interesting for anybody who likes number crunching." This quite important, I believe. I've been following the hyper-accurate USCRN network for a while. These stations, while they have not been around for more than a decade, are located in remote areas across the U.S., and because they are free of possible contamination from human activity, are free of "corrections". I'd been wondering why USCRN was reporting hot weather, while everyone I know was stating how cool it was, so I started looking at the data for individual stations. What I found was, for many stations, no data has been used since May 2014. I've looked at 82 stations so far, and 37 have not been used since May 2014. When I plot the data from these stations, it's apparent that these stations show falling temperatures. The fall experienced by some stations is huge. I had faith in USCRN because nobody was interfering with the data. Now it seems that data which clashes with a warming hypothesis is not modified, it is excluded. Here's a plot of Springfield, CO. A five degree drop in 4 years. www1.ncdc.noaa.gov/pub/data/uscrn/products/daily01/obsolete/2006/ |
|
|
|
Post by walnut on Aug 29, 2016 2:58:46 GMT
The solar drop over 24 has not been that big and the cycle is over, so if 25 stays close to 24 it will turn into a meh event. I don't see the cold. SC24 F10.7 looks significantly lower to me. It is lower than 20, and the cycles seem to be trending down. Guess we will know in a few more decades. |
|
|
|
Post by missouriboy on Aug 29, 2016 3:04:47 GMT
Found this F B page quite interesting for anybody who likes number crunching." This quite important, I believe. I've been following the hyper-accurate USCRN network for a while. These stations, while they have not been around for more than a decade, are located in remote areas across the U.S., and because they are free of possible contamination from human activity, are free of "corrections". I'd been wondering why USCRN was reporting hot weather, while everyone I know was stating how cool it was, so I started looking at the data for individual stations. What I found was, for many stations, no data has been used since May 2014. I've looked at 82 stations so far, and 37 have not been used since May 2014. When I plot the data from these stations, it's apparent that these stations show falling temperatures. The fall experienced by some stations is huge. I had faith in USCRN because nobody was interfering with the data. Now it seems that data which clashes with a warming hypothesis is not modified, it is excluded. Here's a plot of Springfield, CO. A five degree drop in 4 years. ftp.ncdc.noaa.gov/pub/data/uscrn/products/monthly01/www1.ncdc.noaa.gov/pub/data/uscrn/products/daily01/obsolete/2006/ Great job Fred. You should forward this to the chair of the US Senate Committee on Environment and Public Works ... chairman Jim Inhofe of Oklahoma. Let's see if they want another issue in an election year. Is this just one of many directories? |
|
|
|
Post by fredzl4dh on Aug 29, 2016 3:17:26 GMT
Found this F B page quite interesting for anybody who likes number crunching." This quite important, I believe. I've been following the hyper-accurate USCRN network for a while. These stations, while they have not been around for more than a decade, are located in remote areas across the U.S., and because they are free of possible contamination from human activity, are free of "corrections". I'd been wondering why USCRN was reporting hot weather, while everyone I know was stating how cool it was, so I started looking at the data for individual stations. What I found was, for many stations, no data has been used since May 2014. I've looked at 82 stations so far, and 37 have not been used since May 2014. When I plot the data from these stations, it's apparent that these stations show falling temperatures. The fall experienced by some stations is huge. I had faith in USCRN because nobody was interfering with the data. Now it seems that data which clashes with a warming hypothesis is not modified, it is excluded. Here's a plot of Springfield, CO. A five degree drop in 4 years. ftp.ncdc.noaa.gov/pub/data/uscrn/products/monthly01/Great job Fred. You should forward this to the chair of the US Senate Committee on Environment and Public Works ... chairman Jim Inhofe of Oklahoma. Let's see if they want another issue in an election year. missouriboy could you cut and past the link out of my post and change yours i edited but you had posted before it went through thanks. |
|
|
|
Post by Ratty on Aug 29, 2016 8:57:12 GMT
[ Snip ] Perhaps I am missing something. Take heart MB. I'm missing the sixties and I can remember them.  |
|
|
|
Post by nautonnier on Aug 29, 2016 9:52:50 GMT
This is the problem when government agencies are politicized. It is bad enough with employment statistics but when it also extends to real science it is unforgivable. The functionaries involved should be removed from post.
|
|
|
|
Post by Ratty on Aug 29, 2016 10:00:38 GMT
The solar drop over 24 has not been that big and the cycle is over, so if 25 stays close to 24 it will turn into a meh event. I don't see the cold. SC24 F10.7 looks significantly lower to me. It is lower than 20, and the cycles seem to be trending down. Guess we will know in a few more decades. I'll pray for a rapid advance in cryogenics.  |
|
|
|
Post by walnut on Aug 29, 2016 13:54:04 GMT
You feeling old today Ratty? two posts about it haha
There's a guy in Indonesia with an id card that says he was born in 1870.
If true, just imagine, he was too old for the WW1 draft. He would have made the Spanish American war draft.
|
|
|
|
Post by icefisher on Aug 29, 2016 15:38:17 GMT
Yes they should defund the "climate" compilation efforts using surface station data. The network is not representative, was never designed to be representative. Actually I understand there is a network designed to be representative but is not used because its too cold. And actually I am not suggesting they start using it. Any surface station network is apt to not be representative as the surface is so complex and its not easy to change where you sample to check for accuracy.
This is a world wide problem thanks to Phil Jones dog who ate the raw data used in every surface climate compilation worldwide to some degree.
Satellites really provide the only uniform representative mean of sampling climate data. They have some differences between the services due to use of different satellites and drift corrections but they are relatively close. Taking the tens of millions paid to UK CRU and GISS and NOAA for playing surface station roulette could be put to better use in improving satellite coverage for climate purposes. The only value that the surface station network has ever offered is a look back at long term warming, but the data has been so poorly handled, and lost, that its value is highly questionable.
ARGO reports has undergone the same kind of data tampering. . . .the elimination of the cooling of the early ARGO days on the basis of sea level rise has now morphed to trying to patch up the sea level data as indicators are sea level is now decreasing. Perhaps they will use the tampered ARGO data to do it. . . .
I am not calling fraud here, more like the Keystone Cops. Everybody running amok trying to figure out why their data is not the latest hottest news and how in the heck possibly they could have missed the stuff their competition (for grants) is finding.
|
|
|
|
Post by nautonnier on Aug 29, 2016 17:09:48 GMT
It is easy to tell if the metrics from a system do not support the AGW narrative, there are no reports from that system. So they are rolled out with fanfares at great expense, then as they show no catastrophic warming all the reports from the system are hidden and sit at the end of Error 404 black holes.
It has got to the point that if the system reports drop out of sight then you know that they are reporting cooler than the models.
|
|


