|
|
Post by Ratty on May 13, 2017 2:16:03 GMT
Naut, Will be interesting to see what happens and we will know rather quickly Who is holding the data? I understand that scientists fleeing to France took it with them ... for safe keeping. |
|
|
|
Post by glennkoks on May 13, 2017 3:53:23 GMT
at least there are no surprises with NOAA's forecasts, pretty much always expecting hot, hotter, or hottest And The Farmer's Almanac, Joe Bastardi and Adapt 2030 pretty much always expect cold, colder and coldest. The forecast generally falls somewhere between the two... This year was one of the warmest on record for my part of the globe. With that being said the one arctic front killed my garden and citrus trees. |
|
|
|
Post by missouriboy on May 13, 2017 5:35:11 GMT
at least there are no surprises with NOAA's forecasts, pretty much always expecting hot, hotter, or hottest And The Farmer's Almanac, Joe Bastardi and Adapt 2030 pretty much always expect cold, colder and coldest. The forecast generally falls somewhere between the two... This year was one of the warmest on record for my part of the globe. With that being said the one arctic front killed my garden and citrus trees. Give your latitude some gratitude.  The farther north you go, the faster it's falling away. These are my latest 10-Year trends for five stations south to north across the grain belt from about 38 N to 52 N, from 1890 to 2017. Note that a century ago there was a large temperature range from south to north. By about 1976, the deviation spread for all stations were very tight. Starting in the 1990s, that spread is now growing again. The northern stations that warmed the most, are now cooling the fastest. Currently you can see that best in Spring and Winter, where we now have 2017 data. The last graph shows the UAH lower troposphere temp deviations for the USA-48 placed on top. The grain belt IS North America ... hardly a dime's worth of difference. I think that somebody may have been pushing a little hard on the Winnipeg heat button over the last decade though. So ... hell is starting to freeze over ... and General Sherman is moving back to Texas.  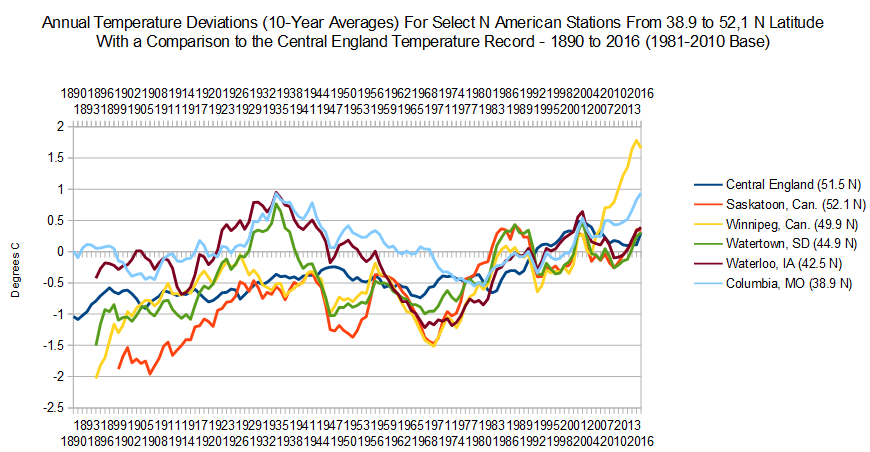 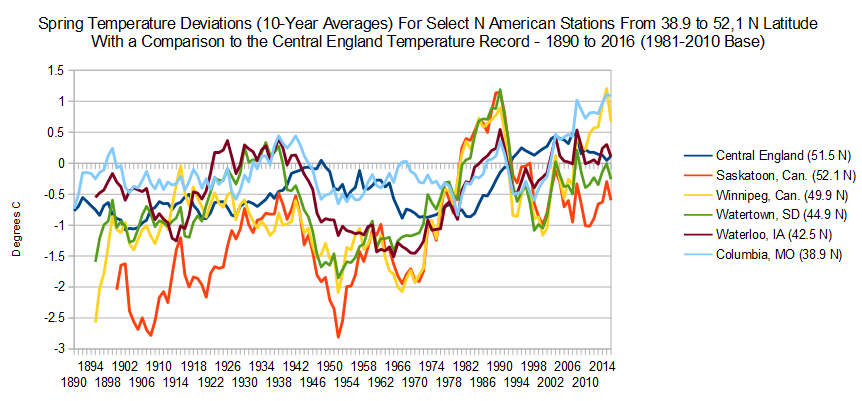 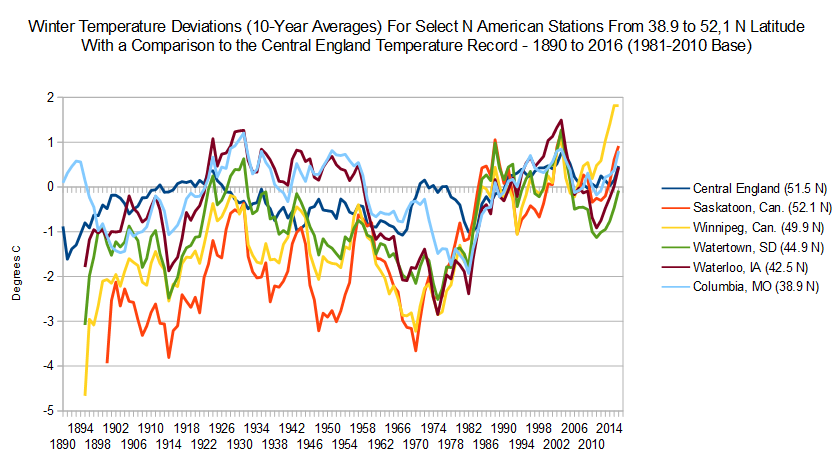 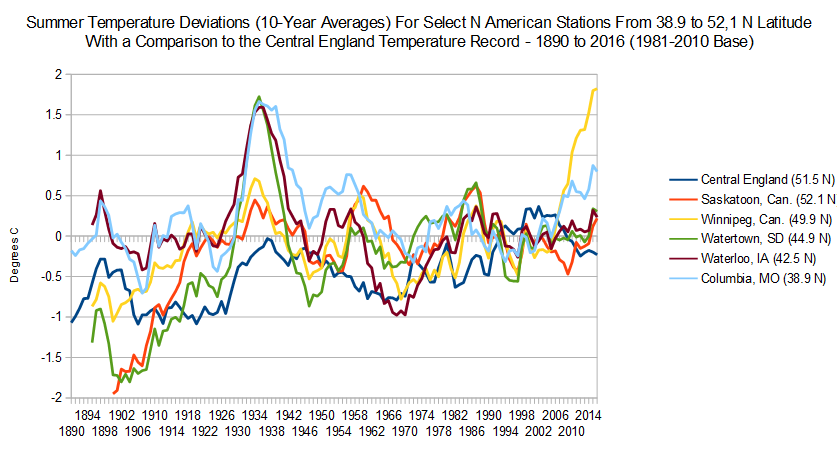 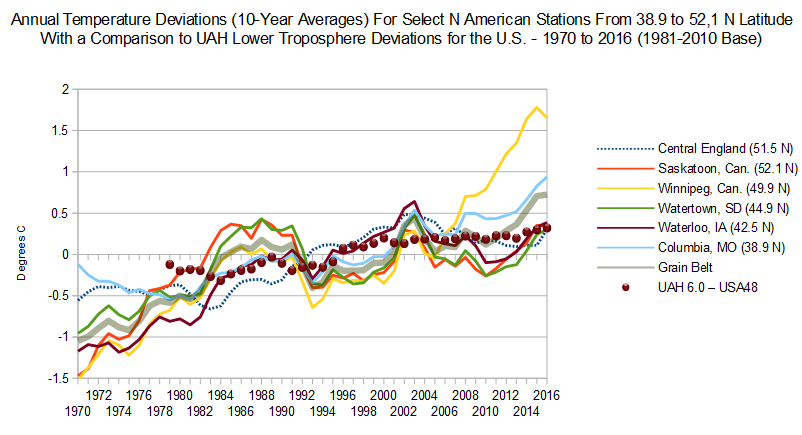 |
|
|
|
Post by Ratty on May 13, 2017 8:50:22 GMT
Winnipeg: Finger on the scale?
|
|
|
|
Post by Ratty on May 13, 2017 9:01:50 GMT
Winnipeg: Finger on the scale?
|
|
|
|
Post by nautonnier on May 13, 2017 12:01:09 GMT
Winnipeg: Finger on the scale? Ratty - have you taut ology? |
|
|
|
Post by missouriboy on May 13, 2017 17:01:13 GMT
Give your latitude some gratitude. The farther north you go, the faster it's falling away. These are my latest 10-Year trends for five stations south to north across the grain belt from about 38 N to 52 N, from 1890 to 2017. Note that a century ago there was a large temperature range from south to north. By about 1976, the deviation spread for all stations were very tight. Starting in the 1990s, that spread is now growing again. The northern stations that warmed the most, are now cooling the fastest. Currently you can see that best in Spring and Winter, where we now have 2017 data. The last graph shows the UAH lower troposphere temp deviations for the USA-48 placed on top. The grain belt IS North America ... hardly a dime's worth of difference. I think that somebody may have been pushing a little hard on the Winnipeg heat button over the last decade though. So ... hell is starting to freeze over ... and General Sherman is moving back to Texas. Look like everything is going up? Note, the trend since 2002 is down for everything north of Columbia, MO if you exclude Winni McHotty. |
|
|
|
Post by Ratty on May 13, 2017 23:31:02 GMT
Winnipeg: Finger on the scale? Ratty - have you taut ology? No Naut. I was a primary school teacher. |
|
|
|
Post by mondeoman on Jul 28, 2017 16:34:25 GMT
But is dry the same as warm? It can be dry and cold, doesn't make the forecast correct.
|
|
|
|
Post by glennkoks on Jul 28, 2017 17:07:46 GMT
In my part of the world every summer is hot. But I will say that as of today we have not hit 100 degrees in 2017. To put it in perspective in 2011 every day in August except one was 100 or hotter. I think we have been very close to our long term norms or perhaps a little below "normal".
|
|
|
|
Post by Ratty on Jul 28, 2017 23:25:45 GMT
Forecast in Oz is for very warm next three months. Climate outlooks – monthly and seasonalClimate outlook overviewAugust to October rainfall is likely to be below average for most of southern mainland Australia. August rainfall is very likely to be below average for the southern half of mainland Australia, while Tasmania is likely to be wetter than average. Daytime and night-time temperatures are likely to be warmer than average for most of Australia. Chances are highest in northern and southeastern Australia, where there is a greater than 80% chance of warmer than average days and nights. August is very likely to see warmer days nationwide, with most of the country having a greater than 80% chance of higher than average maximum temperatures. Both of Australia's major climate drivers at this time of year, the El Niño–Southern Oscillation (ENSO) and the Indian Ocean Dipole (IOD), remain neutral. This means more localised influences such as moderate shifts in the location and strength of the subtropical ridge, local sea surface temperatures and even soil moisture levels are likely to be affecting this outlook. Very warm days locally at the moment. |
|
|
|
Post by sigurdur on Jul 29, 2017 2:07:58 GMT
Are the roos doing ok?
|
|
|
|
Post by Ratty on Jul 29, 2017 5:36:00 GMT
The roos will be here long after man is gone ... possibly in fewer numbers though. (No more sweet green wheat shoots)
|
|


 The farther north you go, the faster it's falling away. These are my latest 10-Year trends for five stations south to north across the grain belt from about 38 N to 52 N, from 1890 to 2017. Note that a century ago there was a large temperature range from south to north. By about 1976, the deviation spread for all stations were very tight. Starting in the 1990s, that spread is now growing again. The northern stations that warmed the most, are now cooling the fastest. Currently you can see that best in Spring and Winter, where we now have 2017 data. The last graph shows the UAH lower troposphere temp deviations for the USA-48 placed on top. The grain belt IS North America ... hardly a dime's worth of difference. I think that somebody may have been pushing a little hard on the Winnipeg heat button over the last decade though.

