|
|
Post by blustnmtn on Oct 15, 2017 20:12:20 GMT
New member “jopo” posted a link in the “Antarctic” thread that contains this site as a source: www.plateclimatology.comAn interesting work that goes far beyond the aresols of explosive volcanoes. A lot of parameters that are missing from the GCMs. |
|
|
|
Post by nautonnier on Oct 15, 2017 22:00:21 GMT
New member “jopo” posted a link in the “Antarctic” thread that contains this site as a source: www.plateclimatology.comAn interesting work that goes far beyond the aresols of explosive volcanoes. A lot of parameters that are missing from the GCMs. One wonders if there is a common causality with the inertial changes in the Earth's varying epitrochoid (there's that word again) orbit causing the tectonic activity _and_ varying the ocean currents due to their momentum and inertia. As you say the GCMs are a little simplistic as you would expect for models made to prove something rather than test the hypothesis. |
|
|
|
Post by blustnmtn on Oct 17, 2017 13:05:52 GMT
|
|
jopo
New Member

Posts: 30 
|
Post by jopo on Oct 17, 2017 13:49:34 GMT
I have no problems in taking this serious. There is a paper i have read on seismic activity and Global temperatures some time ago. Not sure if you guys have put this up prviously? Seismic activity was used as a proxy for geothermal flux www.omicsonline.org/open-access/the-correlation-of-seismic-activity-and-recent-global-warming-2157-7617-1000345.pdfAbstract
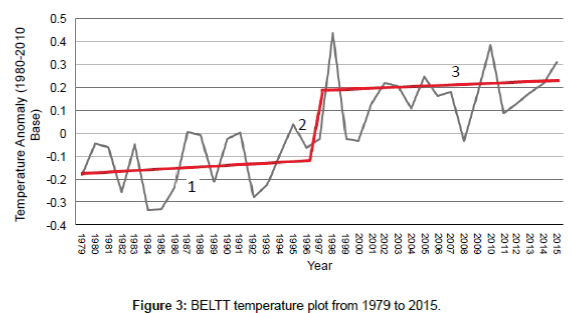
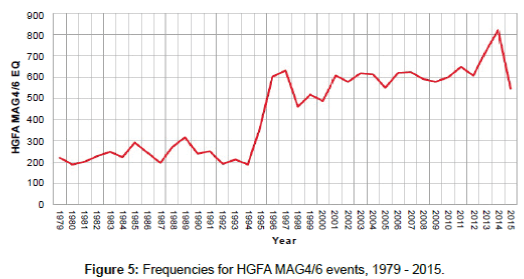
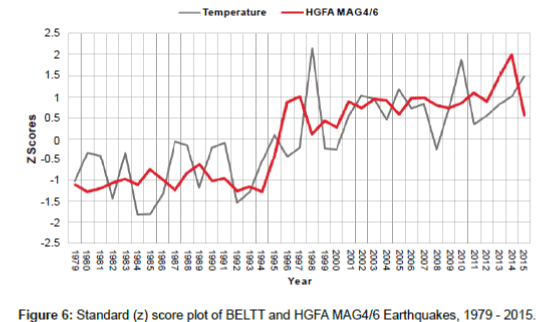
The latest report from the Intergovernmental Panel on Climate Change states with high confidence that the warming of global temperatures since 1901 has been driven by increased radiative forcing. The gases responsible for this enhanced forcing are greenhouse gases of anthropogenic origin, and include carbon dioxide, methane, and halocarbons. The Nongovernmental International Panel on Climate Change has challenged these findings and concludes that the forcing from greenhouse gases is minimal and diminishing. They add that modelling attempts of past and future climate states are inaccurate and do not incorporate important solar inputs, such as magnetic strength and total irradiance. One geophysical variable that has been overlooked by both groups is geothermal flux. This study will show that increasing seismic activity for the globe’s high geothermal flux areas (HGFA), an indicator of increasing geothermal forcing, is highly correlated with average global temperatures from 1979 to 2015 (r = 0.785). By comparison, the correlation between carbon dioxide loading and global temperatures for the same period is lower (r = 0.739). Multiple regression indicates that HGFA seismicity is a significant predictor of global temperatures (P < 0.05), but carbon dioxide concentrations do not significantly improve the explained variance (P > 0.1). A compelling case for geothermal forcing lies in the fact that 1) geothermal heat can trigger thermobaric convection and strengthen oceanic overturning, important mechanisms for transferring ocean heat to the overlying atmosphere, and 2) seismic activity is the leading indicator, while global temperature is the laggard.
Conclusion
Earth’s climate is a remarkably “noisy” system, driven by scores of oscillators, feedback mechanisms, and radiative forcings. Amidst all this noise, identifying a solitary input to the system (i.e., HGFA MAG4/6 seismic activity as a proxy for geothermal heat flux) that explains 62% of the variation in the earth’s surface temperature is a significant finding. Additionally, the 1997/1998 SIENA was a strong signal for subsequent global warming, and this type of seismic jump may provide valuable predictive information. Conversely, if seismic activity gaps downward, this may indicate the onset of a cooling period. Future research clearly needs to incorporate seismic and geothermal inputs into global climate models. The climate community should also begin to explore the impacts of geothermal flux on poorly understood feedbacks, such as Antarctic glacial retreat [40], water vapor, clouds, and the release of methyl hydrates [41].
To ameliorate the problems of rising global temperatures, legislative and taxing initiatives are currently being proposed and evaluated by governing bodies around the world. Most of these initiatives are designed to curb GHG emissions. However, this study shows that we may want to delay such actions until all of the climate system’s inputs are fully accounted for.
|
|
jopo
New Member
Posts: 30
|
Post by jopo on Oct 17, 2017 14:07:53 GMT
|
|
|
|
Post by blustnmtn on Oct 17, 2017 14:33:55 GMT
But a new study shows that they flare up on strikingly regular cycles, ranging from two weeks to 100,000 years—and, that they erupt almost exclusively during the first six months of each year. The pulses—apparently tied to short- and long-term changes in earth’s orbit, and to sea levels--may help trigger natural climate swings. |
|
|
|
Post by Ratty on Nov 17, 2017 7:02:24 GMT
|
|
|
|
Post by Ratty on Nov 17, 2017 12:42:49 GMT
Volcanic Carbon DioxideAbstractA brief survey of the literature concerning volcanogenic carbon dioxide emission finds that estimates of subaerial emission totals fail to account for the diversity of volcanic emissions and are unprepared for individual outliers that dominate known volcanic emissions. Deepening the apparent mystery of total volcanogenic CO2 emission, there is no magic fingerprint with which to identify industrially produced CO2 as there is insufficient data to distinguish the effects of volcanic CO2 from fossil fuel CO2 in the atmosphere. Molar ratios of O2 consumed to CO2 produced are, moreover, of little use due to the abundance of processes (eg. weathering, corrosion, etc) other than volcanic CO2 emission and fossil fuel consumption that are, to date, unquantified. Furthermore, the discovery of a surprising number of submarine volcanoes highlights the underestimation of global volcanism and provides a loose basis for an estimate that may partly explain ocean acidification and rising atmospheric carbon dioxide levels observed last century, as well as shedding much needed light on intensified polar spring melts. Based on this brief literature survey, we may conclude that volcanic CO2 emissions are much higher than previously estimated, and as volcanic CO2 contributions are effectively indistinguishable from industrial CO2 contributions, we cannot glibly assume that the increase of atmospheric CO2 is exclusively anthropogenic.
|
|
|
|
Post by blustnmtn on Nov 17, 2017 15:23:36 GMT
When I look at the plots for atmospheric CO2 that are derived from the ice core samples, I always wonder about the temporal resolution differences between those ancient data points compared to the brief, real time sampling we have now. What if the ramp up in CO2 that we see in today’s atmospheric measurements is a transient that is a common occurrence in earth history that cannot be resolved in ice core sampling. If the out gassing of volcanism spiked for 50 years 1000, 10000, 100000, or 10M years ago, is that “spike” going to be resolved or averaged out? I think it would be averaged out but I might be way off base. I’d like to hear what the guys here that are steeped in the physics and chemistry of CO2 and the atmosphere think. Please be gentle.
|
|
|
|
Post by nautonnier on Nov 17, 2017 17:09:56 GMT
When I look at the plots for atmospheric CO2 that are derived from the ice core samples, I always wonder about the temporal resolution differences between those ancient data points compared to the brief, real time sampling we have now. What if the ramp up in CO2 that we see in today’s atmospheric measurements is a transient that is a common occurrence in earth history that cannot be resolved in ice core sampling. If the out gassing of volcanism spiked for 50 years 1000, 10000, 100000, or 10M years ago, is that “spike” going to be resolved or averaged out? I think it would be averaged out but I might be way off base. I’d like to hear what the guys here that are steeped in the physics and chemistry of CO2 and the atmosphere think. Please be gentle. I agree that it is averaged out - as in all sampling that is of low temporal resolution. There is also the effect of CO 2 diffusion in the ice over millenia. See also: CO2 diffusion in polar ice: observations from naturally formed
CO2 spikes in the Siple Dome (Antarctica) ice core
Jinho AHN,1,2 Melissa HEADLY,1 Martin WAHLEN,1 Edward J. BROOK,2
Paul A. MAYEWSKI,3 Kendrick C. TAYLOR4
1
Scripps Institution of Oceanography, University of California–San Diego, La Jolla, California 92093-0225, USA
E-mail: jinhoahn@gmail.com 2
Department of Geosciences, Oregon State University, Corvallis, Oregon 97331-5506, USA 3
Climate Change Institute, University of Maine, 303 Bryand Global Sciences Center, Orono, Maine 04469-5790, USA 4
Desert Research Institute, University of Nevada, 2215 Raggio Parkway, Reno, Nevada 89512-1095, USA
ABSTRACT. One common assumption in interpreting ice-core CO2 records is that diffusion in the ice
does not affect the concentration profile. However, this assumption remains untested because the
extremely small CO2 diffusion coefficient in ice has not been accurately determined in the laboratory. In
this study we take advantage of high levels of CO2 associated with refrozen layers in an ice core from
Siple Dome, Antarctica, to study CO2 diffusion rates. We use noble gases (Xe /Ar and Kr /Ar), electrical
conductivity and Ca2+ ion concentrations to show that substantial CO2 diffusion may occur in ice on
timescales of thousands of years. We estimate the permeation coefficient for CO2 in ice is 4
10–21 mol m–1 s
–1 Pa–1 at –238C in the top 287 m (corresponding to 2.74 kyr). Smoothing of the CO2
record by diffusion at this depth/age is one or two orders of magnitude smaller than the smoothing in the
firn. However, simulations for depths of 930–950 m (60–70 kyr) indicate that smoothing of the CO2
record by diffusion in deep ice is comparable to smoothing in the firn. Other types of diffusion (e.g. via
liquid in ice grain boundaries or veins) may also be important but their influence has not been quantified.
digitalcommons.library.umaine.edu/cgi/viewcontent.cgi?article=1023&context=ers_facpubThere are other papers raising similar points that the bubbles and the mix of gasses in them are effectively regenerated due to pressure drop from the huge pressure that the ice was under to the surface pressure. Gases held diffused in the ice and as clathrates form the bubbles and there is no way of knowing what the actual air mixture was. |
|
|
|
Post by sigurdur on Nov 17, 2017 17:58:57 GMT
Diffusion is a well known problem with ice core Data. This creates a well known resolution problem.
Someday??? climate scientists may acknowledge this, but don't hold your breath.
|
|
|
|
Post by blustnmtn on Nov 17, 2017 18:34:28 GMT
I didn’t know any of that! My speculation was based only on the obvious difference in measurement resolution. Thanks for the info!
|
|
|
|
Post by duwayne on Nov 17, 2017 19:01:09 GMT
Ratty, How much CO2 is being emitted into the atmosphere each year by volcanoes? Any emissions into the ocean are another category since the oceans aren’t emitting CO2 on a net basis. |
|
|
|
Post by Ratty on Nov 17, 2017 23:25:39 GMT
Ratty, How much CO2 is being emitted into the atmosphere each year by volcanoes? Any emissions into the ocean are another category since the oceans aren’t emitting CO2 on a net basis. Duwayne, Robyn Wylie's article is about terrestrial degassing of CO2. |
|
|
|
Post by Ratty on Nov 18, 2017 1:29:45 GMT
New member “jopo” posted a link in the “Antarctic” thread that contains this site as a source: www.plateclimatology.comAn interesting work that goes far beyond the aresols of explosive volcanoes. A lot of parameters that are missing from the GCMs. This is a great thread, Blue. Thanks for starting.  PS: I should be out mowing the lawn, not sitting at the computer.  |
|


