|
|
Post by acidohm on Sept 11, 2018 17:48:50 GMT
Ok, so my forecasts are admittedly looking a bit, erm, incorrect.....technically speaking 🤔 So here's someone else's, ECMWF, winter pressure forecast. Judging by the analysis, if you are of a slightly weak disposition, look away now, go make a coffee or something.... www.gavsweathervids.com/flash.html ......  Never fear, Acid, you still have that 50/50 chance of being correct. 🤣 yes Ratty....but HOW wintery?? Reading between the lines, there's an indication probabilities on very, are increased somewhat on this information.... |
|
|
|
Post by acidohm on Sept 11, 2018 17:53:05 GMT
Ok, so my forecasts are admittedly looking a bit, erm, incorrect.....technically speaking 🤔 So here's someone else's, ECMWF, winter pressure forecast. Judging by the analysis, if you are of a slightly weak disposition, look away now, go make a coffee or something.... www.gavsweathervids.com/flash.htmlBeen nice knowing ya Acid.  On the brighter side, plumbers may be a hot commodity this winter. Wonder if this supports Astro's forecast for a late-starting North American winter? NW Europe gets trashed ALL winter and N America gets it late and extending into spring (the season shift)? Generally it seems either north Europe or north America go cold but rarely both.... Can't remember what happened US 2009-2012 Or so, but I do remember soon after this was the first time I heard the term "polar vortex" which made US very cold, however we were somewhat less cold by then.... |
|
|
|
Post by missouriboy on Sept 13, 2018 1:45:49 GMT
Been nice knowing ya Acid. On the brighter side, plumbers may be a hot commodity this winter. Wonder if this supports Astro's forecast for a late-starting North American winter? NW Europe gets trashed ALL winter and N America gets it late and extending into spring (the season shift)? Generally it seems either north Europe or north America go cold but rarely both.... Can't remember what happened US 2009-2012 Or so, but I do remember soon after this was the first time I heard the term "polar vortex" which made US very cold, however we were somewhat less cold by then.... 2009-10 was a "both sides cold" winter. |
|
|
|
Post by acidohm on Sept 13, 2018 4:39:55 GMT
Generally it seems either north Europe or north America go cold but rarely both.... Can't remember what happened US 2009-2012 Or so, but I do remember soon after this was the first time I heard the term "polar vortex" which made US very cold, however we were somewhat less cold by then.... 2009-10 was a "both sides cold" winter. Ah ok, thanks Missouri 😊 |
|
|
|
Post by missouriboy on Sept 13, 2018 15:33:33 GMT
2009-10 was a "both sides cold" winter. Ah ok, thanks Missouri 😊 Was rushed and didn't post graphs. So here! The long US Midwest NS Cross-section and the European Atlantic Fringe stations. Chart 2 shows that while winter 2017-18 may have been worse than usual in parts of Europe, it did not match 2009-10 or 2010-11 on "the Fringe". Chart 1 shows that CET deviations do often, but not always run in sync with the upper Midwest. For example, winter 2013-14 was colder than normal in the Midwest but not in England. There is that ominous downslope into solar minimum that started in 2016 staring you in the face. Us too I guess. BNKY Given the series of 3 reasonably cold, snowy winters of 2008-09 to 2010-11 spanning the solar minimum between SC23 and SC24. I believe it would not be unreasonable to expect the same (or worse) in the currently unfolding solar minimum. At this point I think it's only a matter of the depth, number and extent. I see no reason not to bet on a repeating trend that seems to be underway. The New Deniers will be increasingly challenged to explain those parts of conflicting reality they cannot hide. They will strive mightily ... struggling to explain how hot becomes cold and melt becomes freeze ... as they shed adherents along their "mushy" edges. No coup can put Humpty Mann back together again and the money is going bye-bye. No other American President could successfully sell a mule as a racehorse to a common sense American Heartland. I am making a strategic guess that that last statement is still essentially true. Jobs and disposable income are much greater attractors. Fingers crossed. 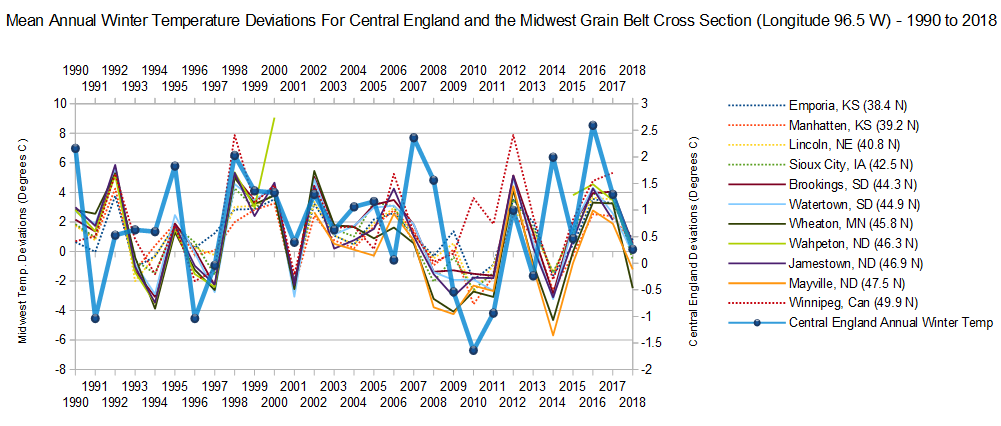  |
|
|
|
Post by acidohm on Sept 13, 2018 21:17:35 GMT
Was rushed and didn't post graphs. So here! The long US Midwest NS Cross-section and the European Atlantic Fringe stations. Chart 2 shows that while winter 2017-18 may have been worse than usual in parts of Europe, it did not match 2009-10 or 2010-11 on "the Fringe". Chart 1 shows that CET deviations do often, but not always run in sync with the upper Midwest. For example, winter 2013-14 was colder than normal in the Midwest but not in England. There is that ominous downslope into solar minimum that started in 2016 staring you in the face. Us too I guess. BNKY  That us/cet graph is very interesting, how sometimes the correlation in so strong, yet falls so completely out of step otherwise. I'd hazard a guess all down to blocking patterns/position, got me thinking, I'll ask somewhere.... Over time I've come to think of cold as more of a top down effect, ie, stratosphere effecting tropospheric patterns reducing the zonal flow. Whereas around 2015 when the Atlantic had it's very cold pool, I felt that was perhaps a turning point in European climatic conditions, tho in that state it proved short-lived I wonder if really cold conditions are a combination of the two? Tho I'm sure the Atlantic would have to cool 5°c or more to have dramatic influence on the otherwise warming effect, something it seems reluctant to do. Then judging by the stubbornness of the GS to be anything other then very warm....don't know.... |
|
|
|
Post by sigurdur on Sept 13, 2018 21:50:16 GMT
|
|
|
|
Post by Ratty on Sept 13, 2018 22:02:00 GMT
Was rushed and didn't post graphs. So here! The long US Midwest NS Cross-section and the European Atlantic Fringe stations. Chart 2 shows that while winter 2017-18 may have been worse than usual in parts of Europe, it did not match 2009-10 or 2010-11 on "the Fringe". Chart 1 shows that CET deviations do often, but not always run in sync with the upper Midwest. For example, winter 2013-14 was colder than normal in the Midwest but not in England. There is that ominous downslope into solar minimum that started in 2016 staring you in the face. Us too I guess. BNKY That us/cet graph is very interesting, how sometimes the correlation in so strong, yet falls so completely out of step otherwise.I'd hazard a guess all down to blocking patterns/position, got me thinking, I'll ask somewhere.... Over time I've come to think of cold as more of a top down effect, ie, stratosphere effecting tropospheric patterns reducing the zonal flow. Whereas around 2015 when the Atlantic had it's very cold pool, I felt that was perhaps a turning point in European climatic conditions, tho in that state it proved short-lived I wonder if really cold conditions are a combination of the two? Tho I'm sure the Atlantic would have to cool 5°c or more to have dramatic influence on the otherwise warming effect, something it seems reluctant to do. Then judging by the stubbornness of the GS to be anything other then very warm....don't know.... Could this mean that weather and climate are complex?  |
|
|
|
Post by missouriboy on Sept 19, 2018 15:19:13 GMT
Is the Winter "Setup" Already Emerging
www.meteociel.fr/modeles/gfse_cartes.php?ech=12&code=0&mode=13&carte=1If you look at the 6-192 hr forecasts of temp at 500hPa, the extremely cold core this September is setting up west of Greenland. Scroll down across 6 to 192 hours and notice how the big cold wheel rotates. Now switch the year to 2017 and compare the same time period at 500hPa. Note the setup north of Greenland and "the roll" into Siberia. Month to month changes give a good picture of winter 2017. With the current geographic setup, is this a winter where the southeastward plunge and roll takes out both Eastern N America and Western Europe?
|
|
|
|
Post by acidohm on Sept 19, 2018 16:13:55 GMT
Is the Winter "Setup" Already Emerging
www.meteociel.fr/modeles/gfse_cartes.php?ech=12&code=0&mode=13&carte=1If you look at the 6-192 hr forecasts of temp at 500hPa, the extremely cold core this September is setting up west of Greenland. Scroll down across 6 to 192 hours and notice how the big cold wheel rotates. Now switch the year to 2017 and compare the same time period at 500hPa. Note the setup north of Greenland and "the roll" into Siberia. Month to month changes give a good picture of winter 2017. With the current geographic setup, is this a winter where the southeastward plunge and roll takes out both Eastern N America and Western Europe? The polar vortex is very weak right now Moboy... weatheriscool.com/index.php/stratosfaren-zonalvind-10hpa-60n-gfs-ens/This will reduce zonal flow and allow northerly airmasses to intrude further south much more easily, so yes, it's certainly possible for a widespread N Hemisphere cold experience further south then usual. All the long range models seem to be picking up on this with northern blocking predominating in the outlook. GWV is running the winter updates and looked at analogues for each winter month after hot, dry summer's and there's a very strong blocking signal there. |
|
|
|
Post by Ratty on Sept 20, 2018 6:07:57 GMT
Acid, there is not much help on the website. Can you save me a lot of reading and give me a quick run-down on the graph itself? What is it telling us - apart from the suggestion of an anteater's alimentary canal? 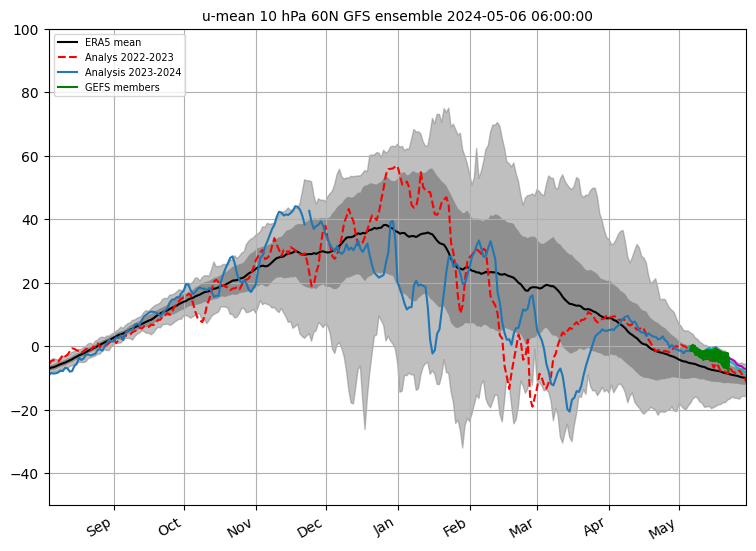 |
|
|
|
Post by acidohm on Sept 20, 2018 8:58:17 GMT
Acid, there is not much help on the website. Can you save me a lot of reading and give me a quick run-down on the graph itself? What is it telling us - apart from the suggestion of an anteater's alimentary canal? Black is average, the yellow is the limits that have been recorded, green and the line within is the short range outlook with mean and ensemble spread. The others are different longer range model outlooks as designated in the table. The figures are for temp at 10hpa and 60°n as a proxy for vortex strength. Personally, I watch the 10 & 30hpa at 90°n as this is where the changes during ssw occur but this graph is a good indicator for a broader view of the state of the n hemisphere atmosphere. HOW are you familiar with the biology of an anteaters alimentary canal Ratty??? |
|
|
|
Post by Ratty on Sept 20, 2018 12:07:02 GMT
[ Snip ] HOW are you familiar with the biology of an anteaters alimentary canal Ratty??? Common knowledge amongst us mammals, Acid. Thanks for the explanation .... cheque's in the mail. |
|
|
|
Post by missouriboy on Sept 20, 2018 17:36:24 GMT
Acid, there is not much help on the website. Can you save me a lot of reading and give me a quick run-down on the graph itself? What is it telling us - apart from the suggestion of an anteater's alimentary canal? Black is average, the yellow is the limits that have been recorded, green and the line within is the short range outlook with mean and ensemble spread. The others are different longer range model outlooks as designated in the table. The figures are for temp at 10hpa and 60°n as a proxy for vortex strength. Personally, I watch the 10 & 30hpa at 90°n as this is where the changes during ssw occur but this graph is a good indicator for a broader view of the state of the n hemisphere atmosphere. HOW are you familiar with the biology of an anteaters alimentary canal Ratty??? Any links to good summaries of Northern Hemisphere Atmos. pressure patterns (spatial & intensity), history and driving forces... seasonal and cyclical science and speculation? We know that the Greenland Blocking Index (GBI) runs opposite of the NAO generally. I assume that higher pressure around Greenland lowers the general gradient between the Arctic and the subtropical high pressure zones. Thus the NAO is more negative. Unfortunately the GBI values have not been updated since 2014, although the general NAO value appears to be trending downward when averaged over several years. I assume that Arctic pressure is rising in line with that. I suppose we may see a "spikey" reaction to solar minimum, just as we did in 2009-10. There may be several of these in a row ... separated by less negative years on a downward slope until whatever fire up of SC25. I feel the need for more background.  |
|
|
|
Post by acidohm on Sept 20, 2018 20:12:10 GMT
Black is average, the yellow is the limits that have been recorded, green and the line within is the short range outlook with mean and ensemble spread. The others are different longer range model outlooks as designated in the table. The figures are for temp at 10hpa and 60°n as a proxy for vortex strength. Personally, I watch the 10 & 30hpa at 90°n as this is where the changes during ssw occur but this graph is a good indicator for a broader view of the state of the n hemisphere atmosphere. HOW are you familiar with the biology of an anteaters alimentary canal Ratty??? Any links to good summaries of Northern Hemisphere Atmos. pressure patterns (spatial & intensity), history and driving forces... seasonal and cyclical science and speculation? We know that the Greenland Blocking Index (GBI) runs opposite of the NAO generally. I assume that higher pressure around Greenland lowers the general gradient between the Arctic and the subtropical high pressure zones. Thus the NAO is more negative. Unfortunately the GBI values have not been updated since 2014, although the general NAO value appears to be trending downward when averaged over several years. I assume that Arctic pressure is rising in line with that. I suppose we may see a "spikey" reaction to solar minimum, just as we did in 2009-10. There may be several of these in a row ... separated by less negative years on a downward slope until whatever fire up of SC25. I feel the need for more background. I'm just reading this... journals.ametsoc.org/doi/10.1175/2007JAS2337.1Certainly contains a good history, may take a while for me to digest the whole thing so figured you could get a head start..... |
|


 On the brighter side, plumbers may be a hot commodity this winter.
