|
|
Post by nautonnier on Nov 19, 2019 12:09:05 GMT
Bad news as a weak El Nino can mean lots of snow for the CONUS and for Europe
|
|
|
|
Post by missouriboy on Jan 4, 2020 20:36:45 GMT
ENSO and UAH Lower Troposphere Global Ocean Temperatures Compared to Solar Indices Observations on 40 Years of ENSO, Satellite and Solar Data Chart 1. Global Lower Troposphere Ocean temperature anomalies follow (lag) ENSO and ENSO follows Solar Cycles. There is one exception to this generalization, 1991-92, when global ocean temperatures drop while ENSO is rising. Chart 2. Global Lower Troposphere Land temperature anomalies follow ENSO, although the lag is not as great. Chart 1. Eastward pulses of warmer, tropical Pacific ocean waters occur at two locations relative to the solar cycle: immediately before and during cycle onset (these are what Astro refers to as El Ninos), and those that occur along the declining flank of solar cycles due to unspecified forces. Chart 1. ENSO shows declining values since SC21. While UAH global ocean temperature anomalies since 2016 (4 years) stand at a higher level than from 1998 to 2015 (18 years), they are declining at a faster rate than the post-cycle comparable of 2002-2006. Pre-cycle El Ninos continue a 20-year decline since 1997. Post-Nino La Nina minimums since 1997 (granted, there are only two) have declined along a slope that looks very similar to El Ninos. If this trend also continues, we could make some friendly wagers as to whether Astro's forecasted 2021-2022 La Nina sets records. If that is to occur, then sometime in the next 20 months or so, that ENSO line will need to plummet. Perhaps we should start a poll. 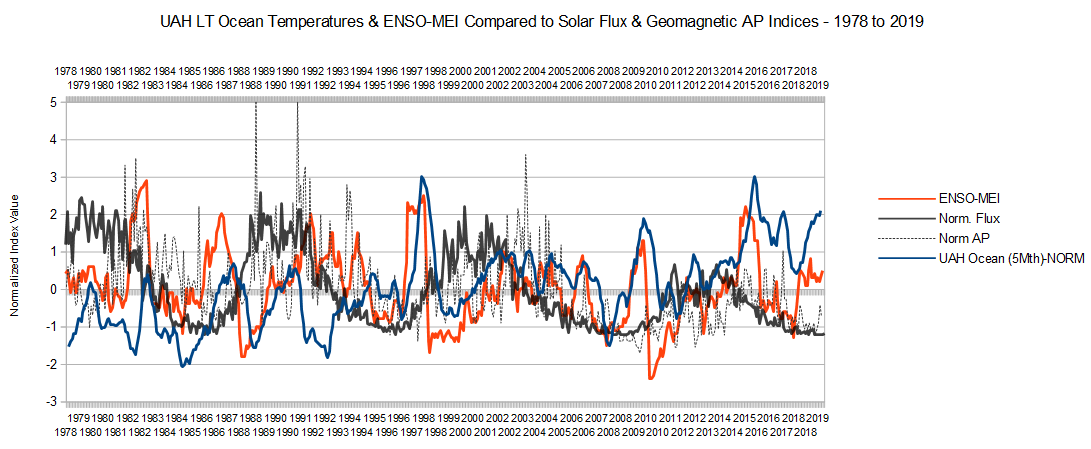 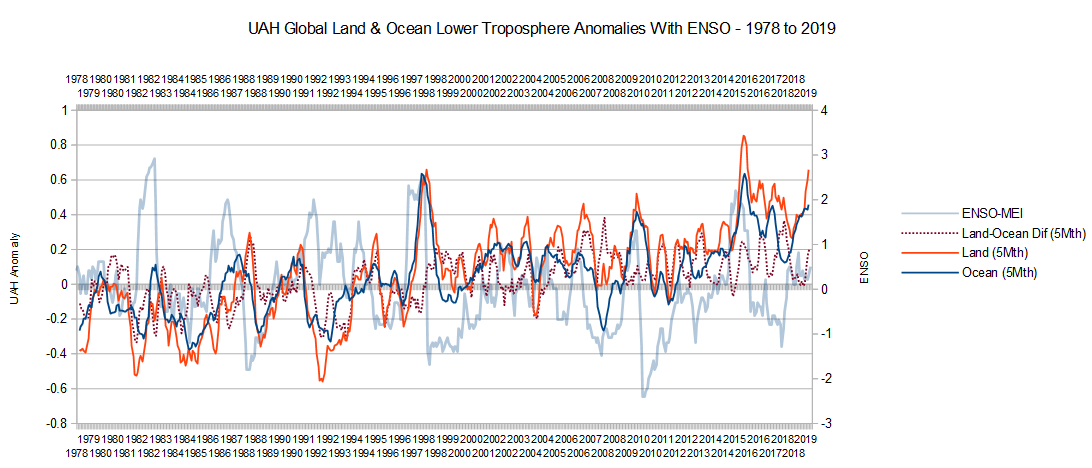 |
|
|
|
Post by duwayne on Jan 5, 2020 18:22:03 GMT
ENSO and UAH Lower Troposphere Global Ocean Temperatures Compared to Solar Indices Observations on 40 Years of ENSO, Satellite and Solar Data Chart 1. Global Lower Troposphere Ocean temperature anomalies follow (lag) ENSO and ENSO follows Solar Cycles. There is one exception to this generalization, 1991-92, when global ocean temperatures drop while ENSO is rising. Chart 2. Global Lower Troposphere Land temperature anomalies follow ENSO, although the lag is not as great. Chart 1. Eastward pulses of warmer, tropical Pacific ocean waters occur at two locations relative to the solar cycle: immediately before and during cycle onset (these are what Astro refers to as El Ninos), and those that occur along the declining flank of solar cycles due to unspecified forces. Chart 1. ENSO shows declining values since SC21. While UAH global ocean temperature anomalies since 2016 (4 years) stand at a higher level than from 1998 to 2015 (18 years), they are declining at a faster rate than the post-cycle comparable of 2002-2006. Pre-cycle El Ninos continue a 20-year decline since 1997. Post-Nino La Nina minimums since 1997 (granted, there are only two) have declined along a slope that looks very similar to El Ninos. If this trend also continues, we could make some friendly wagers as to whether Astro's forecasted 2021-2022 La Nina sets records. If that is to occur, then sometime in the next 20 months or so, that ENSO line will need to plummet. Perhaps we should start a poll. Missouri, I can see the ENSO/UAH relationship, but the 11-year cycle correlation with Enso and/or UAH isn’t so clear. I’m looking for 5 and a half year periods between tops and bottoms. Have you tried to run a “correlation coefficient” using an Excel spreadsheet? |
|
|
|
Post by missouriboy on Jan 7, 2020 3:38:20 GMT
Here you go DuWayne. If ENSO is a measurement of net energy in the East Tropical Pacific, then the following chart shows that a 5-year centered running average has peaks that lag the solar cycle maximum years. It also shows a cyclical, continuous decline over the period 1978-2019. Energy peaks and troughs have become increasingly lower over this period. If Astro is correct about the depth of a forecasted 2021-22 La Nina, then the centered 5-year trend line should drop like a rock over the next 3 years. The post-cycle peak appears to be higher in alternate years if a sample of four means anything. 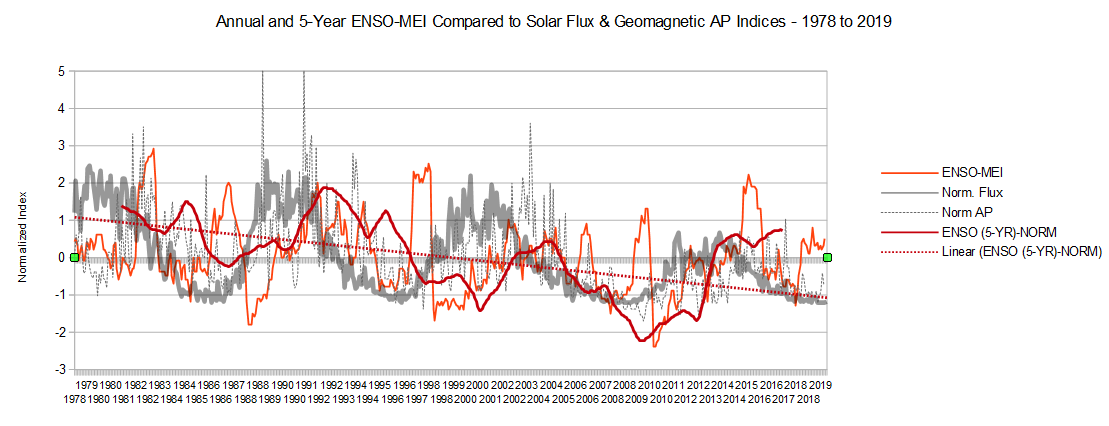 |
|
|
|
Post by duwayne on Jan 7, 2020 20:04:12 GMT
Here you go DuWayne. If ENSO is a measurement of net energy in the East Tropical Pacific, then the following chart shows that a 5-year centered running average has peaks that lag the solar cycle maximum years. It also shows a cyclical, continuous decline over the period 1978-2019. Energy peaks and troughs have become increasingly lower over this period. If Astro is correct about the depth of a forecasted 2021-22 La Nina, then the centered 5-year trend line should drop like a rock over the next 3 years. The post-cycle peak appears to be higher in alternate years if a sample of four means anything. Missouri, can you describe how the 5-year centered ENSO line is calculated. My guess was that a 5-year centered running average point would be calculated by averaging the ENSO for 5 years which includes the 2 preceeding years, the 2 following years and the current year. If I look at the first peak in the ENSO 5-year Norm line (1964?), it occurs when the ENSO numbers are low, less than zero. An average of the 5 numbers centered below the first peak would be less than zero versus the plotted value of about 1.5. Obviously I am not interpreting your calculation correctly. |
|
|
|
Post by missouriboy on Jan 8, 2020 1:26:44 GMT
Here you go DuWayne. If ENSO is a measurement of net energy in the East Tropical Pacific, then the following chart shows that a 5-year centered running average has peaks that lag the solar cycle maximum years. It also shows a cyclical, continuous decline over the period 1978-2019. Energy peaks and troughs have become increasingly lower over this period. If Astro is correct about the depth of a forecasted 2021-22 La Nina, then the centered 5-year trend line should drop like a rock over the next 3 years. The post-cycle peak appears to be higher in alternate years if a sample of four means anything. Missouri, can you describe how the 5-year centered ENSO line is calculated. My guess was that a 5-year centered running average point would be calculated by averaging the ENSO for 5 years which includes the 2 preceeding years, the 2 following years and the current year. If I look at the first peak in the ENSO 5-year Norm line (1964?), it occurs when the ENSO numbers are low, less than zero. An average of the 5 numbers centered below the first peak would be less than zero versus the plotted value of about 1.5. Obviously I am not interpreting your calculation correctly. I'm using a monthly ENSO database. I started it in Dec. 1979 because I already had it to accompany the UAH data set. The ENSO (5-YR) Normalized line should perhaps be labeled a centered 61-month average (30 mths before to 30 mths after the record point). The first point is 31 months beyond Dec. 1979 and it increments in 1 month intervals till it reaches its end point ... 30 months before the end of the series. Each monthly point value is then normalized by subtracting the whole period average and dividing by the whole period standard deviation. I could extend it across the rest of the ENSO-MEI database. |
|
|
|
Post by duwayne on Jan 8, 2020 17:41:35 GMT
Missouri, can you describe how the 5-year centered ENSO line is calculated. My guess was that a 5-year centered running average point would be calculated by averaging the ENSO for 5 years which includes the 2 preceeding years, the 2 following years and the current year. If I look at the first peak in the ENSO 5-year Norm line (1964?), it occurs when the ENSO numbers are low, less than zero. An average of the 5 numbers centered below the first peak would be less than zero versus the plotted value of about 1.5. Obviously I am not interpreting your calculation correctly. I'm using a monthly ENSO database. I started it in Dec. 1979 because I already had it to accompany the UAH data set. The ENSO (5-YR) Normalized line should perhaps be labeled a centered 61-month average (30 mths before to 30 mths after the record point). The first point is 31 months beyond Dec. 1979 and it increments in 1 month intervals till it reaches its end point ... 30 months before the end of the series. Each monthly point value is then normalized by subtracting the whole period average and dividing by the whole period standard deviation. I could extend it across the rest of the ENSO-MEI database. Missouri, it probably would make sense to extend the chart back and maybe just show the flux and running average ENSO. |
|
|
|
Post by missouriboy on Jan 8, 2020 19:40:11 GMT
I'm using a monthly ENSO database. I started it in Dec. 1979 because I already had it to accompany the UAH data set. The ENSO (5-YR) Normalized line should perhaps be labeled a centered 61-month average (30 mths before to 30 mths after the record point). The first point is 31 months beyond Dec. 1979 and it increments in 1 month intervals till it reaches its end point ... 30 months before the end of the series. Each monthly point value is then normalized by subtracting the whole period average and dividing by the whole period standard deviation. I could extend it across the rest of the ENSO-MEI database. Missouri, it probably would make sense to extend the chart back and maybe just show the flux and running average ENSO. Extended to 1950, which is the modern product time series extent. I 86ed the AP but kept the annual ENSO as a less distractive light screen, as it provides a preview to coming attractions. The 1976 "Climate Shift" certainly stands out. Too bad that the satellite data enters at a high point.  |
|
|
|
Post by duwayne on Jan 9, 2020 17:25:15 GMT
Missouri, it probably would make sense to extend the chart back and maybe just show the flux and running average ENSO. Extended to 1950, which is the modern product time series extent. I 86ed the AP but kept the annual ENSO as a less distractive light screen, as it provides a preview to coming attractions. The 1976 "Climate Shift" certainly stands out. Too bad that the satellite data enters at a high point. Missouri, are you ready to make a prediction for the next couple of years? Is a super La Nina likely? |
|
|
|
Post by missouriboy on Jan 9, 2020 21:44:44 GMT
Extended to 1950, which is the modern product time series extent. I 86ed the AP but kept the annual ENSO as a less distractive light screen, as it provides a preview to coming attractions. The 1976 "Climate Shift" certainly stands out. Too bad that the satellite data enters at a high point. Missouri, are you ready to make a prediction for the next couple of years? Is a super La Nina likely? ENSO seems to follow solar cycles. The PDO follows ENSO and appears to be heading down again. The AMO is also moving lower. If SC25 is similar to SC24, we have not seen such an event since the 1870s-90s, where SC13 was somewhat higher than SC12, and our data for that period is not good. Our only reasonably documented low solar cycle was a singleton ... SC20 ... which produced ENSO minimums slightly higher than 2009-10. Based on past response and current trend, we should expect a Nina at least as low and long as 2009-10 ... perhaps lower and longer if such effects are cumulative. Based on that, I will predict that the odds look good for a large Nina in the 2021-22 timeframe. Right or wrong, we should learn something. Every Tom-thingy Denier and Believer will have their antennas tuned to the Climate Superbowl. |
|
|
|
Post by sigurdur on Jan 9, 2020 22:08:18 GMT
I bought a ticket 67 years ago
|
|
|
|
ENSO-2019
Jan 9, 2020 22:25:43 GMT
via mobile
Post by acidohm on Jan 9, 2020 22:25:43 GMT
Missouri, are you ready to make a prediction for the next couple of years? Is a super La Nina likely? ENSO seems to follow solar cycles. The PDO follows ENSO and appears to be heading down again. The AMO is also moving lower. If SC25 is similar to SC24, we have not seen such an event since the 1870s-90s, where SC13 was somewhat higher than SC12, and our data for that period is not good. Our only reasonably documented low solar cycle was a singleton ... SC20 ... which produced ENSO minimums slightly higher than 2009-10. Based on past response and current trend, we should expect a Nina at least as low and long as 2009-10 ... perhaps lower and longer if such effects are cumulative. Based on that, I will predict that the odds look good for a large Nina in the 2021-22 timeframe. Right or wrong, we should learn something. Every Tom-thingy Denier and Believer will have their antennas tuned to the Climate Superbowl. Good work Missouri 👍🏻👍🏻 I'm done with examining short to medium range signals for now as there's just nothing in it. Far as I can see theres nothing to tell us what will happen in 2 months time. Tho IOD has probably had greatest influence globally of late (or perhaps warm PNW for you 'mericans) Kicking back and watching ENSO, your analysis ties in well with Astros forecasts. We will see!! |
|
|
|
Post by missouriboy on Jan 10, 2020 0:09:38 GMT
I bought a ticket 67 years ago Fifty yard line? Or did you pick a particular end zone?  |
|
|
|
Post by Ratty on Jan 10, 2020 0:47:57 GMT
I bought a ticket 67 years ago Fifty yard line? Or did you pick a particular end zone? The only problem with your brand of 'football' is that elderly folk may pass on before the game is over. No offence intended. |
|
|
|
Post by nautonnier on Jan 10, 2020 1:31:27 GMT
Fifty yard line? Or did you pick a particular end zone? The only problem with your brand of 'football' is that elderly folk may pass on before the game is over. No offence intended. Can hardly claim that and have cricket 5 day test matches - Although there are times when it is difficult to tell the quick from the dead with some teams..... |
|


