|
|
Post by hilbert on Oct 13, 2009 3:34:19 GMT
It's a bit warmer than normal near the pole. 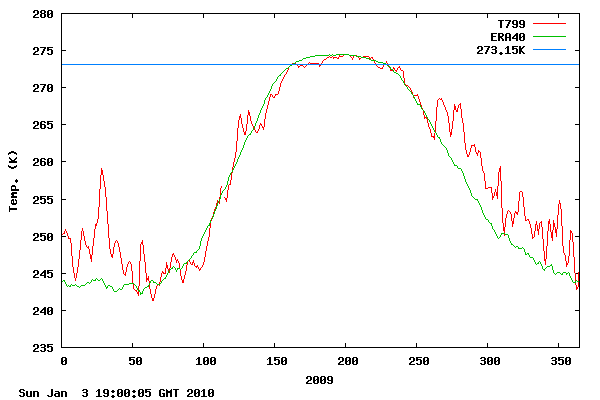 |
|
|
|
Post by poitsplace on Oct 13, 2009 3:53:40 GMT
You know...since warming is such a certainty, someone should start publishing an anomaly map with the 1998-2008 plateau. Otherwise We'll end up looking at misleading, red and orange smeared anomaly maps if the world does happen to cool.  |
|
|
|
Post by msphar on Oct 13, 2009 5:29:46 GMT
To address any concerns here that it is a duck. Its not a duck. Its a wacked out chart. Compare the two - Tale of the Tape and JAXA. JAXA is moving in a nicely controlled manner around its annual low point which it passed about a month ago, climbing nicely now and will reach a narrow range late in October as the last 8 or 9 year tracks show. Cryosphere by comparison is diving like a sperm whale in full squid hunt mode. These are bloody opposite. There is a ring of truth to the JAXA data. Something is inherently wrong with the Cryosphere data. It is behaving in a manner without parallel in its history back to 1979. Clearly it has to be suspect. Quack quack.
|
|
|
|
Post by kiwistonewall on Oct 13, 2009 7:29:01 GMT
The maximum anomaly for Arctic Ice extent was: -1.766 mill sq kms on 8th October. (current less 1979-2000 mean) This doesn't correspond with the minimum date, but indicates that the initial refreeze was "slower" than mean. The current anomaly (11 Oct) is -1.582 million sq kms. The Cryosphere didn't adjust their data when they shifted from the faulty SSMI satellite data series to the AMSRE series. My data is correct! ;D as it uses the overlap between the two series to enable interconversion (as those who have followed this thread for a year or more will remember) Attachments:
|
|
|
|
Post by 6waldog on Oct 13, 2009 19:48:34 GMT
Cryosphere today seems like it is fighting computer gremlins.
They have always posted the previous days ice display in the "Compare" section earlier than it goes on the main display at the top of the page. Frequently hours or days earlier, so I've always checked the "Compare" section when the days image is late.
Today when checking there is no correlation between the dates you request and the dates it images.
For example a request for 1980 images showed a 2008 image. Request for yesterdays image was bouncing around and pulling various dates.
I'm guessing they are scrambling.
Cheers,
6Waldog.
|
|
|
|
Post by neilhamp on Oct 14, 2009 6:16:21 GMT
Arcus have produced their report on the Arctic Ice Minimum www.arcus.org/search/seaiceoutlook/2009_outlook/2009_minimum.phpIt is interesting to note that all of the forcasts were below the final outcome. We have just seen the minimum recover for the second successive year. The last time this happened was 1992. If we experience further recovery in 2010, this will be the first time this has occured since 1979. The summer of 2010 will be most interesting. |
|
|
|
Post by 6waldog on Oct 14, 2009 15:50:24 GMT
Do we have another sensor failing?
Jaxa shows an increase of 60156 sq. km between the 12th and 13th.
Then looking at Cryosphere Today - it's been offline.
Then looking at DMI Their chart has a huge spike straight down.
Looking up the temps in a ring around the ice show the cold areas are still cold.
Barrow - below freezing
Resolute - below freezing
Clyde river - below freezing
Longyearbyen slightly above at 36 F
Murmansk - below freezing
Tiksi - in the region that has had a large increase recently is quite cold at 3 F
Pevak completes the ring, and it's right at freezing.
Cheers
|
|
|
|
Post by matt on Oct 14, 2009 21:00:02 GMT
The Catlin data is now in, and it says the Arctic sea ice has about ten years left. The article was a bit ambiguous in that it said North pole, but he context is fairly clear. This data supports the consensus that the Arctic sea ice will be gone within 20 years, with most of the ice gone within 10 years. cnews.canoe.ca/CNEWS/Environment/2009/10/14/11400976-ap.html |
|
|
|
Post by throttleup on Oct 14, 2009 21:04:51 GMT
Matt, thanks for the update. Do you know if they have their radar sled fixed yet?
|
|
|
|
Post by 6waldog on Oct 14, 2009 21:06:57 GMT
Catlin - Data
Those two words seem incongruous.
I especially liked how this was an AP release.
Cheers.
|
|
|
|
Post by throttleup on Oct 14, 2009 21:30:00 GMT
Yeah, I wonder if their data repeats itself over and over... sorta like their biometric readings...
Well, now they know they have only a few precious years to go back and recover their fuel drums before they pollute the pristine Arctic Ocean.
|
|
|
|
Post by sigurdur on Oct 14, 2009 22:46:39 GMT
The Catlin data is now in, and it says the Arctic sea ice has about ten years left. The article was a bit ambiguous in that it said North pole, but he context is fairly clear. This data supports the consensus that the Arctic sea ice will be gone within 20 years, with most of the ice gone within 10 years. cnews.canoe.ca/CNEWS/Environment/2009/10/14/11400976-ap.htmlLet's see.......they did this last winter.....covered very little area, their sled was broke most of the time......and they actually did a report?  You really have to be kidding me. Ya know, if a normal person reported what that article said, he/she would be laughed out of town. So, tiz back to the same......not valid reporting on not valid science. And.....a nice feller like Matt is getting sucked in......that is a huge shame! |
|
|
|
Post by matt on Oct 15, 2009 0:01:46 GMT
awww, thank you sigurdur! |
|
|
|
Post by jimcripwell on Oct 15, 2009 0:33:50 GMT
Does anyone have a reference to the actual Catlin report? All I can find is reports about the Catlin report. What I would like to know is what this report forecast what would happen the the ice melt in 2009. After all the data was collected well in time to forecast what should have happened 4 months after the expedition was all over.
|
|
|
|
Post by fischer on Oct 15, 2009 2:14:17 GMT
|
|


