|
|
Post by kiwistonewall on Aug 26, 2009 21:47:25 GMT
Re Roos/Jaxa et al - remember that the AMSR-E DATA is a set of radar "temperatures" in three frequencies in four polarities (12 feeds of data on a point grid) - anyone (with the right resources) can obtain the data and build an ice algorithm to calculate ice extent. The SSMI data was based on fewer frequencies & a different instrument - the main one now having failed) So the ALGORITHM is the thing - how the data is interpreted into ice/water/snow/rain etc. This is no easy task, and we discussed this at length a year or so ago. The ice has different densities based on age, weathering and type. The JAXA series is proven to discount new ice - and appears only sensitive to old ice. In the years when ice was declining, this was accurate, but they haven't re-calibrated for a period of recovery. Old ice (say 4-6 years) will be quite different from 1 & 2 year ice. This Isn't a fault in the data, or the satellite. The data could be re-calibrated. I can just see the grant application now ( for funds to correct the data and show a lot more ice)  In any case, whatever is done always going to have a high error (from +/- 10-25%) Weather can be filtered out to some extent by taking a series of data over several days, but cloud can sit over the arctic for days. All we can say is that there is certainly a lot more ice there than shown by the processed images. The Alaskan and Canadian charts, when they add in data obtained from other sources show the additional ice. We can assume that there is also a lot more ice on the Russian side. How much more we cannot say. Jaxa data may have been consistently wrong (the data may be comparable with past years) or it may be drifting into error in two ways: 1. The instruments may be drifting. 2. The data isn't calibrated for recovered ice radar "color". In the years of decline 2002-2007, each winter would have ended up with only OLD ice and very little young ice of any description. 2008 and 2009 would have had increasing retention of 1 & 2 year ice. This is what seems to be missing from the Jaxa data. You can find links to the raw radar images here: sharaku.eorc.jaxa.jp/cgi-bin/adeos2/amsr/l3brws/l3brws.cgi?lang=e&sat=P1&ad=A&prd=IC0_Com&ver=new&map=PN&y=2009&m=8&d=25&ny=2009&nm=8&nd=25Note this image: When you "know" where the ice is, you can see it, but it is far from certain to a automated program: 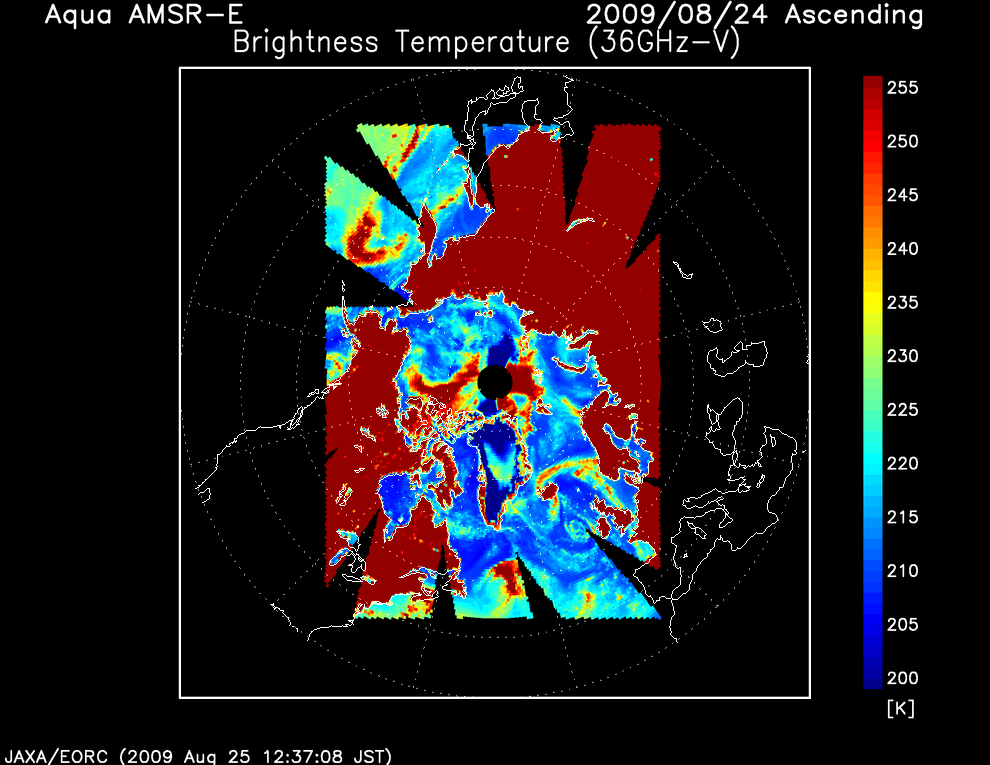 |
|
|
|
Post by woodstove on Aug 26, 2009 22:17:55 GMT
As others have asked, do you require the ice to rebound in a single year in order to see a recovery? No I don't - but I do require more evidence than the fact there is more ice now than during the massive loss in 2007. Do you, by the way, reject NOAA's ice map (provided above by Kiwi) showing far more widespread ice in the Chukchi Sea and Beaufort Sea than JAXA, Arctic ROOS, and NSIDC?Dunno - I haven't looked. You seem happy to flit from source to source depending on which gives the preferred result. Both Arctic Roos and Jaxa have been fairly consisent over the last few years but because Arctic Roos tends to report more ice than Jaxa, I can see it's attraction. Now you bring another source which supposedly shows more ice than the rest. But what was it showing last year or 10 years ago -what is it showing in other regions. This is exactly the sort of thing Michael Mann did with the H-S. He used different data sources to show that 20th century warming was unprecedented. We're still waiting, with bellies ready to laugh, for your explanation regarding the 2007 yin-yang of sea ice in the two hemispheres, i.e. all-time record in the Antarctic (which has shown a slow, relatively steady increase of area during the satellite era). Please explain how the increase in Antarctic sea ice is in keeping with theories regarding co2-related global warming.Now I'm not a great fan of climate models but to give them their due the predictions for the key climate indicators do tend to be in the right direction, e.g. temperatures and arctic ice to name two. There is also this from the IPCC TAR (2001). For the change in annual mean surface air temperature in the various cases, the model experiments show the familiar pattern documented in the SAR with a maximum warming in the high latitudes of the Northern Hemisphere and a minimum in the Southern Ocean (due to ocean heat uptake) evident in the zonal mean for the CMIP2 models (Figure 9.8) and the geographical patterns for all categories of models (Figure 9.10).See www.grida.no/publications/other/ipcc%5Ftar/?src=/climate/ipcc_tar/wg1/351.htm No obfuscation required about the different providers of data. I asked a simple question about a map that has been shown on this thread several times of late. Do you find it credible or not? Re the IPCC TAR predictions: Models rule! Someone better tell Real Climate that Steig's paper disagrees with their models. Doh! It's cooling, as predicted, but it's warming, as predicted, but you wouldn't understand, as predicted, so we'll keep changing our story, as predicted. |
|
|
|
Post by kiwistonewall on Aug 27, 2009 21:48:51 GMT
Jaxa close up. Where we are at: 1. Jaxa algorithm is badly calibrated and underestimates the ice. 2. This has always been the case and may (or may not) have got worse. 3. Studying the 12 radar images (used in the algorithm) it does appear that the new ice signal is impossible to detect, so it may simply be that some types of ice (age, density etc) just cannot be detected by AMSR-E (My current thinking) - 4. So no conspiracy to hide the ice, just that the satellite cannot see a lot of it. 5. Problem appears to be with recovered ice (lower density) 6. This problem has been there in 2007 and 2008 as well, so we really have no real idea of where we are. 7. In summer, we should read these charts as OLD ice that is surviving the summer melt, rather than total ice. This is understandable, and the loss of old ice is acknowledged, but is now recovering. 5. The "speed" of melt or the "speed" of recovery in late Autumn are thus artifacts of the satellite loosing/seeing types of ice and cannot be interpreted (by either side of the debate) as any indication of real melting or freezing. So, for what it's worth: 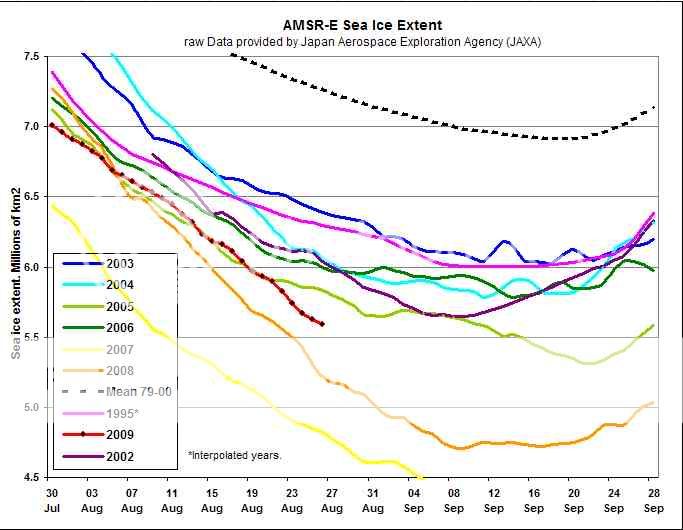 |
|
|
|
Post by kiwistonewall on Aug 27, 2009 22:56:09 GMT
Found the full arctic NOAA images here: arcweb.natice.noaa.gov/ICEWEB2/Default.aspxIf you compare these with the same date JAXA image, you'll see that only what noaa shows as red (90%+) appears on the JAxa image. You need to select regions & dates. 21st August: Arctic: 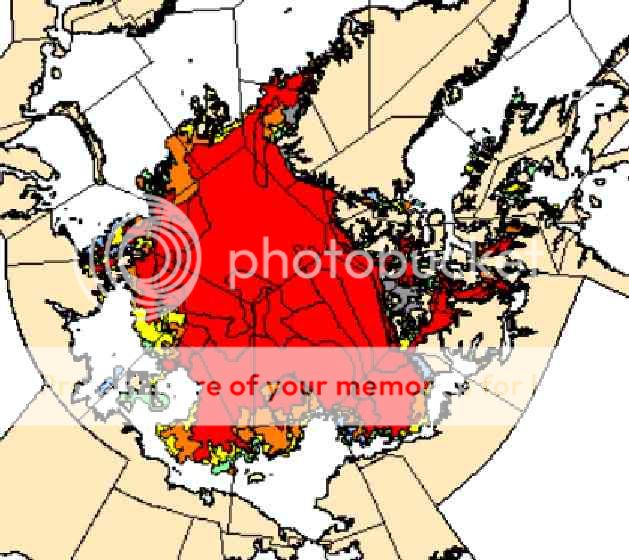 |
|
|
|
Post by radiant on Aug 28, 2009 4:52:50 GMT
A few of the North West passage boats are now out of the ice areas. To add to the drama of the freeze up date i thought this was interesting from Ocean watch: www.aroundtheamericas.org/story/Crew+Log+74+-+At+Sea+72+41N%2C+92+08WThe interesting part of this was how we'd all avoided talking about what might happen after Bellot Strait or Peel Sound because it was by no means certain that we'd make it out of either and into Lancaster Sound and Baffin Bay - this year.
"While we were making our way toward Bellot Strait we encountered very heavy ice - stuff that hadn't been predicted - and that was one thing. The other was that most of the surface water between the ice floes was either frozen or in the process of freezing and each bay we passed was chock full of ice - that's precisely how boats for the past 300 years have found themselves suddenly and unexpectedly bound into an Arctic winter, |
|
|
|
Post by neilhamp on Aug 28, 2009 6:27:15 GMT
It does look as though melt rate is starting to slow down.
Daily Sq.Km. ice loss from JAXA since 24th. August
24 78,000
25 65,000
26 45,000
27 35,000
28 23,000
|
|
|
|
Post by kiwistonewall on Aug 28, 2009 7:28:28 GMT
|
|
|
|
Post by neilhamp on Aug 28, 2009 7:59:19 GMT
This is what was said by NSIDC on 26th.August 2008
Sea ice extent has fallen below the 2005 minimum, previously the second-lowest extent recorded since the dawn of the satellite era. Will 2008 also break the standing record low, set in 2007? We will know in the next several weeks, when the melt season comes to a close. The bottom line, however, is that the strong negative trend in summertime ice extent characterizing the past decade continues.
What I find interesting the the gleefull tone of the above comment
Compare it to the more somber tone of this year's announcement
During the first half of August, Arctic ice extent declined more slowly than during the same period in 2007 and 2008. The slower decline is primarily due to a recent atmospheric circulation pattern, which transported ice toward the Siberian coast and discouraged export of ice out of the Arctic Ocean. It is now unlikely that 2009 will see a record low extent, but the minimum summer ice extent will still be much lower than the 1979 to 2000 average.
Let's hope this year's minimum keeps above 2005
|
|
|
|
Post by magellan on Aug 28, 2009 11:52:14 GMT
This is what was said by NSIDC on 26th.August 2008 Sea ice extent has fallen below the 2005 minimum, previously the second-lowest extent recorded since the dawn of the satellite era. Will 2008 also break the standing record low, set in 2007? We will know in the next several weeks, when the melt season comes to a close. The bottom line, however, is that the strong negative trend in summertime ice extent characterizing the past decade continues. What I find interesting the the gleefull tone of the above comment Compare it to the more somber tone of this year's announcement During the first half of August, Arctic ice extent declined more slowly than during the same period in 2007 and 2008. The slower decline is primarily due to a recent atmospheric circulation pattern, which transported ice toward the Siberian coast and discouraged export of ice out of the Arctic Ocean. It is now unlikely that 2009 will see a record low extent, but the minimum summer ice extent will still be much lower than the 1979 to 2000 average. Let's hope this year's minimum keeps above 2005 The same NSIDC, headed up by alarmist extraordinaire Mark Serreze, also said in 2008: North Pole Could Be Ice Free in 2008abcnews.go.com/Technology/Story?id=4728737&page=1"This raises the spectre – the possibility that you could become ice free at the North Pole this year." Does anyone really think these charlatans will admit error? They've painted themselves in a box making and staked their reputations on such statements and will not back down; those research funds need to be justified. |
|
|
|
Post by jimcripwell on Aug 28, 2009 13:08:04 GMT
magellan writes "Does anyone really think these charlatans will admit error? They've painted themselves in a box making and staked their reputations on such statements and will not back down; those research funds need to be justified."
I agree with your sentiments 100%, and I hate to take the side of a warmaholic. Unfortunately, many scientists feel they have to bow to the edicts of the warmaholic church in order to get funds in the first place. The next report is due out next week. It will be interesting to see how NSIDC tries to get itself some wiggle room. We still have 3 more days of data to come in from August. If the current trend continues, it is going to be difficult for NSIDC to be both scientific, and maintain the warmaholic dogma.
|
|
|
|
Post by douglavers on Aug 28, 2009 13:30:44 GMT
Looking at the site below: ice-glaces.ec.gc.ca/Ice_Can/ANIM-CMMBCTCA.gifI would say Hudson Bay ice will be gone at the end of August, which I am told is extremely late. The water will have had very little time to pick up extra heat. Bearing in mind Arctic refreeze will be starting mid September, I think my Canadian in-laws are in for an early and chilly winter. |
|
|
|
Post by ron on Aug 28, 2009 19:09:47 GMT
The next report is due out next week. It will be interesting to see how NSIDC tries to get itself some wiggle room. We still have 3 more days of data to come in from August. If the current trend continues, it is going to be difficult for NSIDC to be both scientific, and maintain the warmaholic dogma. Here's my prediction: "August finished with the third lowest ice extent since the dawn of the satellite age, surpassed in its lowness only by the record setting and polar bear devastating years of 2007 and 2008. Save the whales." |
|
|
|
Post by kiwistonewall on Aug 28, 2009 22:37:57 GMT
Where does 2009 really rank (given the hopeless state of the Satellites!) (as at 24th August) Western Arctic since 1971: Rank 11th lowest of 39: 5 lowest years are: 2008, 1998, 2007, 1995, 1993 (in order from lowest) Source: ice-glaces.ec.gc.ca/prods/CVCHACTWA/20090824180000_CVCHACTWA_0004540388.gif
Eastern Arctic since 1971: Rank second lowest of 39. 5 lowest years: 2006, 2009, 1975, 2000, 2005 Source: ice-glaces.ec.gc.ca/prods/CVCHACTEA/20090824180000_CVCHACTEA_0004540600.gif
While Hudson Bay since 1971: Rank: 7th highest(33rd lowest) of 39 5 Lowest Years: 2006, 1999, 2001, 2005, 1998 immediately one is struck by the fact that different areas of the Arctic are in opposition: some show "warming" some show "cooling" - and there is no overall trend in any locality in any direction. (Directionless data is a sure sign of a turning point - such as low tide where the water can surge first one way and then the other for a time) Since (some say) we have had a warming trend for some years, then the only conclusion we can safely draw is that the trend is about to reverse. Of course, there is the possibility that we are at a major pause in a long term uptrend. Then the question is, what is the cause of the pause? |
|
|
|
Post by ron on Aug 29, 2009 4:46:24 GMT
what is the cause of the pause? The elimination of all of those nasty GHG containing polar bear farts. Ever get a whiff of polar bear scat? "Who knows" is probably the most correct answer you'll get to any question about our impact on the environment. |
|
|
|
Post by neilhamp on Aug 29, 2009 6:07:08 GMT
Hmm, JAXA chart suggests fall in ice extent is nearing an end. Arctic temperature shown at ocean.dmi.dk/arctic/meant80n.uk.php is below freezing but seems to be holding up. Looking back at earlier years, the last time arctic temperatures held up like this was 2007 and the El Nino year of 1998 |
|


