|
|
Post by acidohm on Aug 24, 2020 20:22:22 GMT
I can tell ya, 2 months or more ago, the plots largely agree with where we are now, but they thought we'd be deeper into nina. Dug this up.... |
|
|
|
Post by missouriboy on Aug 24, 2020 22:15:08 GMT
Since end of July Nino 4 has gone negative and 3.4 is getting colder.  |
|
|
|
Post by duwayne on Aug 25, 2020 13:26:37 GMT
|
|
|
|
Post by missouriboy on Aug 25, 2020 19:48:46 GMT
Below are two charts showing the weekly SSTA progressions starting the first week of January in each of the La Ninas at the beginning of Solar Cycles 23, 24 and 25 (years 1998, 2010 and 2020). The first chart shows NINO Regions 3 and 4, showing the 2020 La Nina progressing at the same general magnitudes as 1998 and 2010. Mid-Pacific values in 1998 were very high in comparison to 2010 and 2020 ... remnants of a very large Nino in 1997? The NINO 3.4 area may be slightly slower on average. Chart 2 for Nino Region 1+2 shows a large difference between the 1998 and 2010 La Ninas, with starting values much higher for 1998 versus 2010. 2020 values are coincident with 2010. These differences for the larger cycle 23, versus SC24 and the beginnings of SC25, may be significant ... speculations welcome. 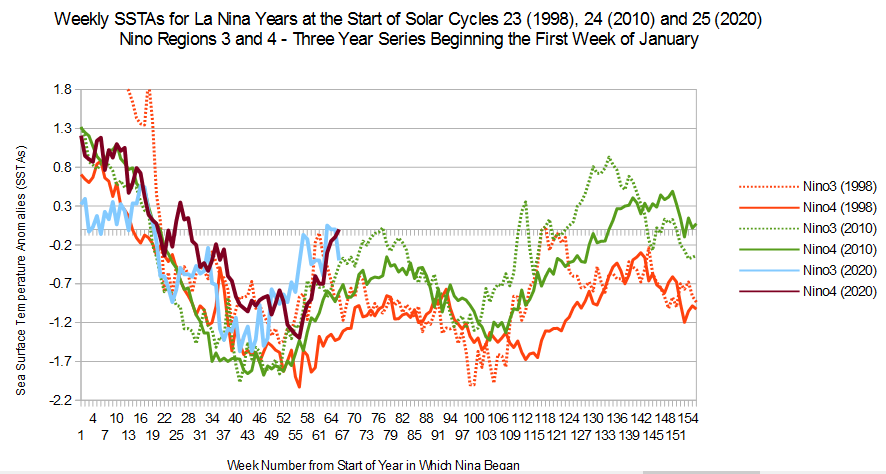 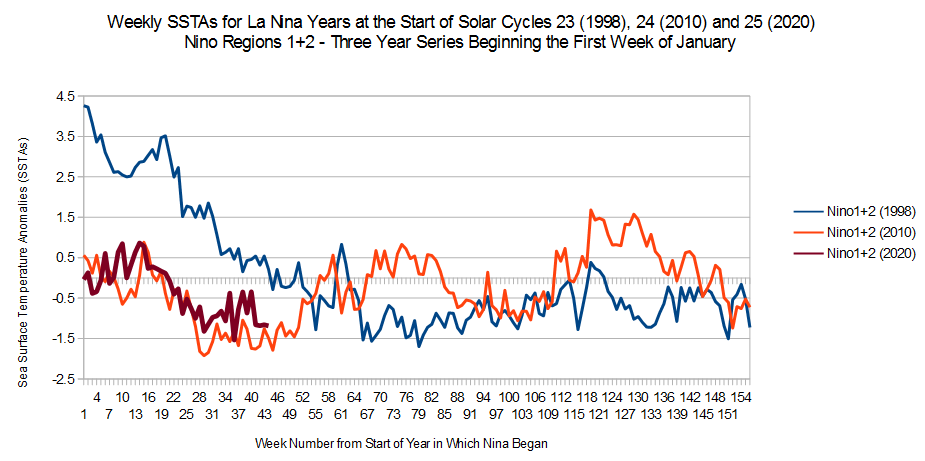 |
|
|
|
Post by acidohm on Aug 25, 2020 21:25:13 GMT
Below are two charts showing the weekly SSTA progressions starting the first week of January in each of the La Ninas at the beginning of Solar Cycles 23, 24 and 25 (years 1998, 2010 and 2020). The first chart shows NINO Regions 3 and 4, showing the 2020 La Nina progressing at the same general magnitudes as 1998 and 2010. Mid-Pacific values in 1998 were very high in comparison to 2010 and 2020 ... remnants of a very large Nino in 1997? The NINO 3.4 area may be slightly slower on average. Chart 2 for Nino Region 1+2 shows a large difference between the 1998 and 2010 La Ninas, with starting values much higher for 1998 versus 2010. 2020 values are coincident with 2010. These differences for the larger cycle 23, versus SC24 and the beginnings of SC25, may be significant ... speculations welcome. This very much overlaps the discussion in the solar cycle 25 thread. Is it possible to define reduced activity with a specific process in a 2 dimensional manner which causes such a correlation? We understand ENSO to be a combination of wind anomalies and sst distribution. To some extent one feedbacks the other. However, central subsurface temps are cooling in situ within the 3&4 regions atm, is this cooler water from 1+2 feeding under surface waters from the east, or upwelling? MJO is currently weak and IOD is at low values, tho this is understood to be correlated to enso. Maybe this helps... www.issibern.ch/teams/interplanetarydisturb/wp-content/uploads/2015/01/Asikainen_03_2014.pdfThis may be the work of a genius or a lunatic....i can't tell... www.john-daly.com/sun-enso/sun-enso.htm |
|
|
|
Post by missouriboy on Aug 25, 2020 21:56:45 GMT
Geniuses and lunatics are closely related. It's a matter of symatics and your viewpoint.  Thanks. First time I've seen these pieces. El Niño and La Niña are subjected to external forcing by the sun’s varying activity to such a degree that it explains nearly all of ENSO’s irregularities and makes long-range forecasts beyond the 1-year limit possible.I think we have seen that this appears to be the case ... at least with the onset of Nina at the beginning of a solar cycle and following a Nino. We also see that UAH lower tropospheric temperatures seem to follow ENSO with a slight lag. We are not the first to notice this obviously. We also see that summed decadal (or longer) values are more positive across powerful solar cycles, and decline as solar cycle strength declines. This would seem to be more than coincidence. It also seems you can see standing waves that lag ENSO superimposed on the larger AMO wave. PDO of course lags ENSO around the Pacific. |
|
|
|
Post by duwayne on Aug 26, 2020 0:53:09 GMT
Below are two charts showing the weekly SSTA progressions starting the first week of January in each of the La Ninas at the beginning of Solar Cycles 23, 24 and 25 (years 1998, 2010 and 2020). The first chart shows NINO Regions 3 and 4, showing the 2020 La Nina progressing at the same general magnitudes as 1998 and 2010. Mid-Pacific values in 1998 were very high in comparison to 2010 and 2020 ... remnants of a very large Nino in 1997? The NINO 3.4 area may be slightly slower on average. Chart 2 for Nino Region 1+2 shows a large difference between the 1998 and 2010 La Ninas, with starting values much higher for 1998 versus 2010. 2020 values are coincident with 2010. These differences for the larger cycle 23, versus SC24 and the beginnings of SC25, may be significant ... speculations welcome. The thing that jumps into my mind when I look at how much warmer ENSO 1+2 was in 1998 is there must have unusually low wind. Evaporation (cooling) increases significantly with wind because the relative humidity is reduced when the vapor is carried away. With no wind the surface temperatures will be significantly higher. |
|
|
|
Post by missouriboy on Aug 26, 2020 4:11:54 GMT
Below are two charts showing the weekly SSTA progressions starting the first week of January in each of the La Ninas at the beginning of Solar Cycles 23, 24 and 25 (years 1998, 2010 and 2020). The first chart shows NINO Regions 3 and 4, showing the 2020 La Nina progressing at the same general magnitudes as 1998 and 2010. Mid-Pacific values in 1998 were very high in comparison to 2010 and 2020 ... remnants of a very large Nino in 1997? The NINO 3.4 area may be slightly slower on average. Chart 2 for Nino Region 1+2 shows a large difference between the 1998 and 2010 La Ninas, with starting values much higher for 1998 versus 2010. 2020 values are coincident with 2010. These differences for the larger cycle 23, versus SC24 and the beginnings of SC25, may be significant ... speculations welcome. The thing that jumps into my mind when I look at how much warmer ENSO 1+2 was in 1998 is there must have unusually low wind. Evaporation (cooling) increases significantly with wind because the relative humidity is reduced when the vapor is carried away. With no wind the surface temperatures will be significantly higher. For proper scale, I extended each cycle back one year for Nino Regions 1+2 and 3.4 to include the preceding El Nino. The 1997-98 combined ENSO event absolutely dwarfs the 2009-10 and the 2019-20 event so far. The effects in Region 1+2 were dramatic. 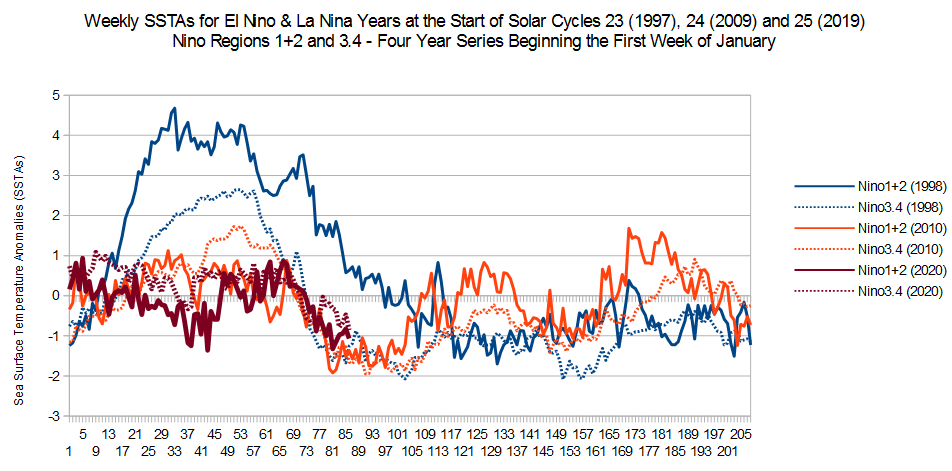 |
|
|
|
Post by nautonnier on Aug 26, 2020 13:30:46 GMT
The thing that jumps into my mind when I look at how much warmer ENSO 1+2 was in 1998 is there must have unusually low wind. Evaporation (cooling) increases significantly with wind because the relative humidity is reduced when the vapor is carried away. With no wind the surface temperatures will be significantly higher. For proper scale, I extended each cycle back one year for Nino Regions 1+2 and 3.4 to include the preceding El Nino. The 1997-98 combined ENSO event absolutely dwarfs the 2009-10 and the 2019-20 event so far. The effects in Region 1+2 were dramatic. Or another way of looking at it is that the current temperatures will run parallel to the 1998 set at 3.5C cooler  |
|
|
|
Post by missouriboy on Aug 30, 2020 18:27:55 GMT
I'll have to invest in heavier longjohns ... or move to Florida. Found this temperature-ENSO comparison in the comments to the latest WUWT Archibald article (amidst the food fight in the comments). www.climatexam.com/post/temperature-increase-since-2016-is-not-anthropogenicAccording to the IPCC science, the temperature increase should have been 0.4°C from 2000 to 2014 (Ref. 1). ENSO (El Niño Southern Oscillation) has strong impacts on the global temperature as can be estimated even by the eye in Fig. 1, where also ONI (Oceanic Niño Index) has been depicted. It looks like that the pause ended to the super El Nino 2015-2016 as shown in Fig. 1.  |
|
|
|
Post by nonentropic on Sept 1, 2020 18:34:08 GMT
Well Ratty while you were sitting around looking the other way your SOI has started to run real positive with intent. www.longpaddock.qld.gov.au/soi/Given the extremely boring nature of your weather in Brisi that is being hot or night time and sometimes both this may give your search for differentiation a little extra rub. We get easterlies with late summer TC's can't wait but will have to wait 6 months. |
|
|
|
Post by Ratty on Sept 2, 2020 7:43:01 GMT
Well Ratty while you were sitting around looking the other way your SOI has started to run real positive with intent.www.longpaddock.qld.gov.au/soi/[ Snip ] Looks strong, doesn't it? |
|
|
|
Post by nonentropic on Sept 2, 2020 8:28:52 GMT
looking good for the flip.
Lifts the spirits actually.
|
|
|
|
Post by missouriboy on Sept 2, 2020 14:23:01 GMT
looking good for the flip. Lifts the spirits actually. Moving right along. But still has a ways to go, as high monthly values get into the 20s and 30s. This graph is updated through August, 2020. 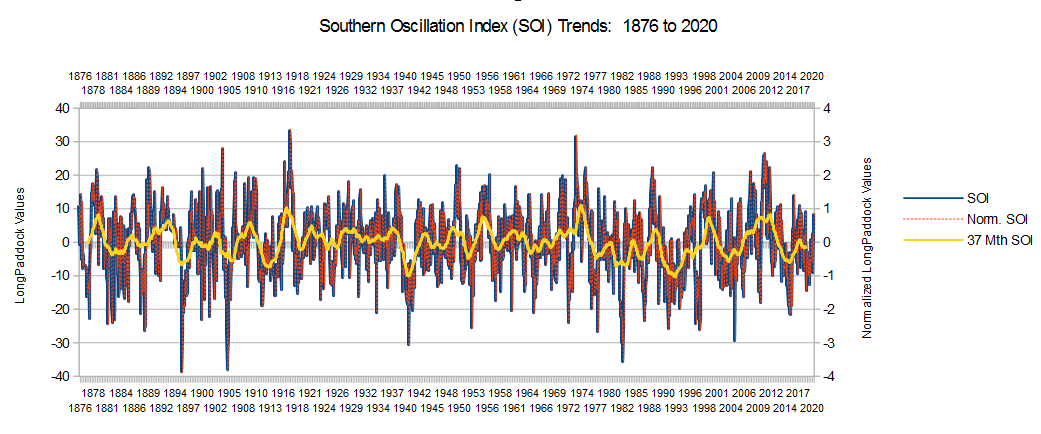 |
|
|
|
Post by duwayne on Sept 3, 2020 14:36:07 GMT
looking good for the flip. Lifts the spirits actually. Moving right along. But still has a ways to go, as high monthly values get into the 20s and 30s. This graph is updated through August, 2020. The SOI is based on pressure differentials between Darwin and Tahiti which are some distance from the equator and are not as far apart as the extremes of the ENSO area. The Equatorial SOI is based on readings on the equator and further apart than Darwin and Tahiti. For the most part the two SOI readings are similar, but in 1998 the Equatorial SOI readings were considerably higher. The Equatorial SOI readings would correlate better with the high ENSO1+2 values in 1998. Over the past few months the Equatorial SOI readings have been higher than SOI. iridl.ldeo.columbia.edu/maproom/ENSO/Time_Series/Equatorial_SOI.htmlwww.climate.gov/news-features/blogs/enso/why-are-there-so-many-enso-indexes-instead-just-one |
|


