|
|
Post by socold on May 11, 2009 7:01:09 GMT
Uh AMO and PDO are related to sea surface temperature, not ocean heat content. Quite right. But since ocean heat content hasn't been directly measured for long at all, the sea surface temps make for as good of a proxy as any for historical trends in ocean heat content. i see, good point |
|
|
|
Post by steve on May 11, 2009 9:24:39 GMT
poitsplace, Please try to keep on topic, and don't let your ideological hatred for "models" get in the way. The question was whether anyone had attempted to assess temperature distributions to work out the amount of energy being radiated to space. The fact that models can do short term forecasts is an indication that they contain a reasonably accurate representation of the atmosphere such that they can be used to do the sort of calculation being asked for. As to ocean heat content, yes it's different from surface temperatures. But, the PDO indices are *not* proxies for temperature, they are related to the relative temperature/pressure distribution. The sea surface temperature anomaly is here:  |
|
|
|
Post by icefisher on May 11, 2009 13:19:50 GMT
poitsplace, Please try to keep on topic, and don't let your ideological hatred for "models" get in the way. The question was whether anyone had attempted to assess temperature distributions to work out the amount of energy being radiated to space. The fact that models can do short term forecasts is an indication that they contain a reasonably accurate representation of the atmosphere such that they can be used to do the sort of calculation being asked for. As to ocean heat content, yes it's different from surface temperatures. But, the PDO indices are *not* proxies for temperature, they are related to the relative temperature/pressure distribution. The sea surface temperature anomaly is here: Wow! If you look closely at those graphs its pretty obvious that SST are leading the change!! How can that be if it is supposed to be the atmosphere warming up and warming the oceans via longwave radiation?  ?? |
|
|
|
Post by magellan on May 11, 2009 13:21:06 GMT
poitsplace, Please try to keep on topic, and don't let your ideological hatred for "models" get in the way. The question was whether anyone had attempted to assess temperature distributions to work out the amount of energy being radiated to space. The fact that models can do short term forecasts is an indication that they contain a reasonably accurate representation of the atmosphere such that they can be used to do the sort of calculation being asked for. As to ocean heat content, yes it's different from surface temperatures. But, the PDO indices are *not* proxies for temperature, they are related to the relative temperature/pressure distribution. The sea surface temperature anomaly is here: ![]() Do a search at Met O for the term 'pacific decadal oscillation' or 'PDO' and get back with us..... |
|
|
|
Post by steve on May 11, 2009 14:05:10 GMT
But, the PDO indices are *not* proxies for temperature, they are related to the relative temperature/pressure distribution. The sea surface temperature anomaly is here: ![]() Do a search at Met O for the term 'pacific decadal oscillation' or 'PDO' and get back with us..... OK, Magellan. I did that. The PDO indices are *not* proxies for temperature. |
|
|
|
Post by jurinko on May 11, 2009 15:29:39 GMT
This is real SST graph, not those smoothed products above. It is clearly visible that SSTs in 2008 are equal to those of 1940s. 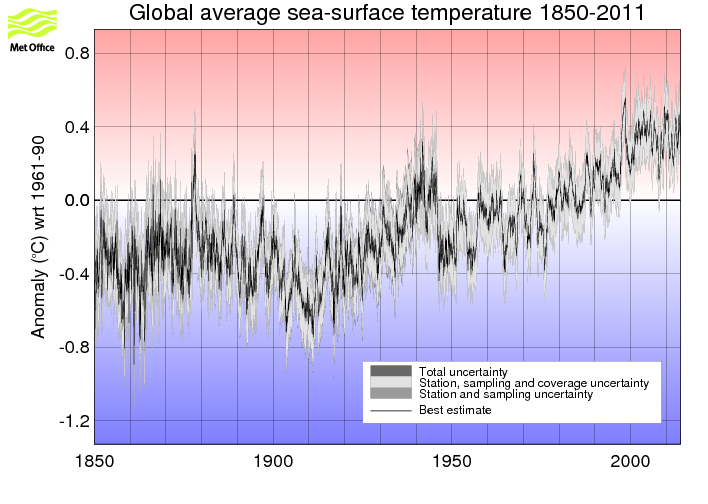 Hard to tell about OHT, SST is the only proxy we can use. |
|
|
|
Post by steve on May 11, 2009 15:56:59 GMT
There were about 20 months during the period 1939-1949 where the SST anomaly was above 0.1C. There have been zero months since January 1997 where the anomaly has been *below* 0.1C. More than half of the months this century have been warmer than the warmest single month 1939-49. hadobs.metoffice.com/hadsst2/diagnostics/global/nh+sh/monthly |
|
|
|
Post by icefisher on May 12, 2009 7:14:23 GMT
There were about 20 months during the period 1939-1949 where the SST anomaly was above 0.1C. There have been zero months since January 1997 where the anomaly has been *below* 0.1C. More than half of the months this century have been warmer than the warmest single month 1939-49. But the only thing we care about Steve is whether the last few months were above the highest few months in circa 1940. If not where is the heat from the unprecedented AGW? Is it hiding? |
|
|
|
Post by steve on May 12, 2009 8:43:58 GMT
There were about 20 months during the period 1939-1949 where the SST anomaly was above 0.1C. There have been zero months since January 1997 where the anomaly has been *below* 0.1C. More than half of the months this century have been warmer than the warmest single month 1939-49. But the only thing we care about Steve is whether the last few months were above the highest few months in circa 1940. Or do you just care about is any measurement that indicates colder weather, even when lots of other things say no significant cooling is happening. If you look at the stats, the sea surface temperatures took a sudden jump in October 1941 which is about the same time as the US Navy started engaging German U boats. Its just my theory, but maybe this had an impact on sea surface measurents. |
|
|
|
Post by icefisher on May 12, 2009 18:49:47 GMT
But the only thing we care about Steve is whether the last few months were above the highest few months in circa 1940. Or do you just care about is any measurement that indicates colder weather, even when lots of other things say no significant cooling is happening. If you look at the stats, the sea surface temperatures took a sudden jump in October 1941 which is about the same time as the US Navy started engaging German U boats. Its just my theory, but maybe this had an impact on sea surface measurents. You didn't answer the important question Steve. If the ocean was as warm or warmer in 1940 compared today where is all the heat from CO2 emission of the past 30 years hiding? This is the fundamental test of AGW and it appears it has flunked. |
|
|
|
Post by socold on May 12, 2009 19:41:52 GMT
Or do you just care about is any measurement that indicates colder weather, even when lots of other things say no significant cooling is happening. If you look at the stats, the sea surface temperatures took a sudden jump in October 1941 which is about the same time as the US Navy started engaging German U boats. Its just my theory, but maybe this had an impact on sea surface measurents. You didn't answer the important question Steve. If the ocean was as warm or warmer in 1940 compared today where is all the heat from CO2 emission of the past 30 years hiding? The graph only shows the surface temperature of the ocean. |
|
|
|
Post by icefisher on May 12, 2009 22:13:47 GMT
You didn't answer the important question Steve. If the ocean was as warm or warmer in 1940 compared today where is all the heat from CO2 emission of the past 30 years hiding? The graph only shows the surface temperature of the ocean. Doesn't in your mind dissing the best available science amount to being a science denier? |
|
jtom
Level 3 Rank

Posts: 248
|
Post by jtom on May 12, 2009 23:43:58 GMT
Naw, I think what he is implying is that heat formed a conspiracy, dove to the bottom of the ocean, and is hiding in underwater trenches. It's doing that as a test of faith for the believers, and to fool the atheistic deniers.
If enough believers keep the faith, it will one day rise out of the depths of the ocean in all its glory and smite the infidels.
|
|
jtom
Level 3 Rank
Posts: 248
|
Post by jtom on May 13, 2009 0:06:15 GMT
What about the use of atom bombs starting in the mid-'40s and all nuclear testing (USA, GB, France, USSR, China) from 1945 to 1980 (don't have Pakistan, India or Israeli data). There were more than 2044 bomb tests, with 717 of them done in the atmosphere or underwater. It is estimated that the total yield of all the atmospheric nuclear weapons tests conducted is 438 megatons. That's equivalent to 29,200 Hiroshima size bombs. In the 36 years between 1945 and 1980 when atmospheric testing was being conducted this would have been equivalent to exploding a Hiroshima size bomb in the atmosphere every 11 hours. Think that might have cause a little atmospheric heating (they were exploded at a significant altitude, so no dust to block out the sun)?
There has also been a program of 'Peaceful Nuclear Explosions' conducted over the years. The Soviet Union carried out the most extensive PNE program. Some 116 PNE's were conducted between 1965 and 1988: 81 in Russia, 30 in Kazakhstan, two in the Ukraine, two in Uzbekistan and one in Turkmenistan. These PNEs had a variety of uses: deep seismic sounding; creating underground storage cavities; helping to help extract gas and oil; extinguishing burning gas or oil wells; creating reservoirs and; one was used to help build a canal.
The U.S. carried out 27 PNE's between 1961 and 1973: one in Carlsbad, Colorado, one in Grand Valley, Colorado, one in Rifle, Colorado, one in Farmington, New Mexico, and 23 at the National Test Site in Nevada.
Maybe that's what set off global warming.......At any rate, how can ANY temp records from that period be fully understood?
Maybe that's an 'out' for global warmers. Global warming was real, was man-made, but since we quit with the nuclear testing, the climate's returning to normal (whatever that is).
|
|
|
|
Post by hilbert on May 13, 2009 3:18:14 GMT
1 Hiroshima-sized A-bomb ~ 20 kT.
1 kT = 10^12 cal => 1 A-bomb ~ 2 x 10^13 cal <~ (less than or about) 10^14 Joules.
2 bombs/day < 1000 bombs / year, < 10^17 Joules / yr.
According to Hansen, we have been adding 10^22 Joules / yr to the ocean every year since 2003, so the heat addition of the bomb tests is negligible compared to this.
It is an interesting exercise to estimate the amount of heat released by a rainstorm (in latent heat of fusion, e.g.) and compare it with the equivalent megatonnage of nuclear explosions.
|
|


 ??
??
