|
|
Post by icefisher on Jun 4, 2009 20:03:11 GMT
So when does "recovery from the little ice age" end? 2100? 2200? 2600? ...1950? If we assume a linear background warming trend we get a linear future warming trend. Amazing how that works. Yeah you can see thats what the IPCC did Socold, except they showed their ignorance of the ocean oscillations when they did it. When one actually predicts this stuff they really should get some experts on oceans involved since its the main deal in global temperatures. |
|
|
|
Post by socold on Jun 4, 2009 21:39:26 GMT
So when does "recovery from the little ice age" end? 2100? 2200? 2600? ...1950? If we assume a linear background warming trend we get a linear future warming trend. Amazing how that works. Yeah you can see thats what the IPCC did Socold, except they showed their ignorance of the ocean oscillations when they did it. When one actually predicts this stuff they really should get some experts on oceans involved since its the main deal in global temperatures. Yea they should get some physicists in who know how to draw a straight line through data and attribute any amount of warming to "little ice age recovery" without explaining how. That's the kind of no-thought analysis we have been missing all along I guess. |
|
|
|
Post by tacoman25 on Jun 5, 2009 0:02:46 GMT
So when does "recovery from the little ice age" end? 2100? 2200? 2600? ...1950? If we assume a linear background warming trend we get a linear future warming trend. Amazing how that works. There is no evidence yet that GHGs have altered the "linear" warming trend. Therefore, why should we expect they will suddenly (and radically, according to the IPCC) doing that? |
|
|
|
Post by steve on Jun 5, 2009 10:33:48 GMT
So when does "recovery from the little ice age" end? 2100? 2200? 2600? ...1950? If we assume a linear background warming trend we get a linear future warming trend. Amazing how that works. There is no evidence yet that GHGs have altered the "linear" warming trend. Therefore, why should we expect they will suddenly (and radically, according to the IPCC) doing that? Because there is no linear warming trend. HadCRUT3 temps for the 1850s are about 0.4C cooler than the 1940 peak and about the same as the 1890s. Akasofu requires a *very* big oscillation for that. icefisher, The top level of the 2060 "IPCC prediction" area is about 0.7C above the top level of the top projection in the IPCC report (in the IPCC report, I measure it at 2.0C relative to 2000, and I've added 0.4C which is the GISTEMP anomaly at 2000). |
|
|
|
Post by steve on Jun 5, 2009 10:37:01 GMT
I'm happy that this Akasofu plot illustrates the nature of decadal oscillations.
But are we really at a high in the cycle when ENSO has been negative, PDO is in negative territory and we're at a low in the solar cycle?
The underlying trend should be replaced with a physically plausible one based on solar variability, aerosol levels from emissions and volcanoes, and greenhouse gas levels.
|
|
|
|
Post by icefisher on Jun 5, 2009 13:05:53 GMT
icefisher, The top level of the 2060 "IPCC prediction" area is about 0.7C above the top level of the top projection in the IPCC report (in the IPCC report, I measure it at 2.0C relative to 2000, and I've added 0.4C which is the GISTEMP anomaly at 2000). What is your source for that? Seems to me you are splitting hairs looking at the IPCC upper range. A1FI projects as high as 6.4 degrees by 2099, where it is at 2060 I don't know. But half way there 2/3rds of the way seems reasonable. |
|
|
|
Post by icefisher on Jun 5, 2009 13:30:38 GMT
I'm happy that this Akasofu plot illustrates the nature of decadal oscillations. But are we really at a high in the cycle when ENSO has been negative, PDO is in negative territory and we're at a low in the solar cycle? Seems to me the high hit a few years ago as described on the chart, if its not the high then its at least a big bump. The underlying trend should be replaced with a physically plausible one based on solar variability, aerosol levels from emissions and volcanoes, and greenhouse gas levels. Gee you are starting to sound like an overly ambitious skeptic suggesting volcanco eruptions should be predicted. ROTFLMAO! How can you claim that a recovery from the ice age is implausible. Didn't your idol, Dr. Hansen, say last year that the "pipeline" can be a millenia long? Something that happened a few hundred years ago or even a thousand could still be playing out today. |
|
|
|
Post by steve on Jun 5, 2009 13:32:08 GMT
icefisher, The top level of the 2060 "IPCC prediction" area is about 0.7C above the top level of the top projection in the IPCC report (in the IPCC report, I measure it at 2.0C relative to 2000, and I've added 0.4C which is the GISTEMP anomaly at 2000). What is your source for that? Seems to me you are splitting hairs looking at the IPCC upper range. A1FI projects as high as 6.4 degrees by 2099, where it is at 2060 I don't know. But half way there 2/3rds of the way seems reasonable. Spot the difference. The plot is from the Summary for Policy Makers AR4. They appear not to have plotted the A1F scenario. This is the "if you're really stupid and start digging those oil shales drilling those Arctic oil reserves, and knocking down more mountains in the Appalacians for a bit of coal" scenario. Perhaps Akasofu has plotted it and I'm wrong. On the other hand though, he's chosen not to plot the B1 scenario which is an example of his selectiveness. 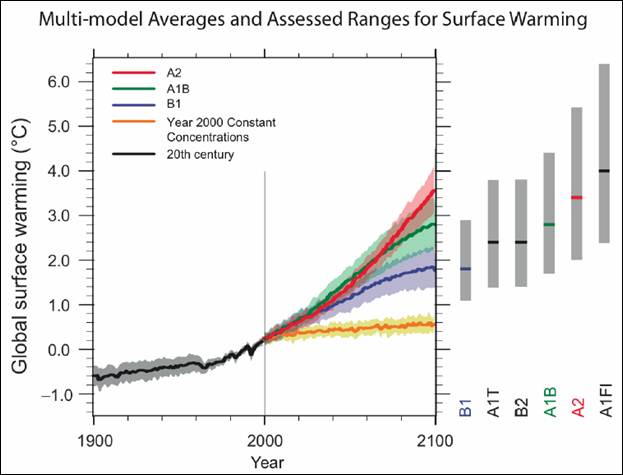  |
|
|
|
Post by icefisher on Jun 5, 2009 13:36:03 GMT
What is your source for that? Seems to me you are splitting hairs looking at the IPCC upper range. A1FI projects as high as 6.4 degrees by 2099, where it is at 2060 I don't know. But half way there 2/3rds of the way seems reasonable. pix You have to look at the side bar because A1FI is not plotted on the graph you have produced here. Additionally what is plotted is plotted with a smaller range than indicated in the AR4 text and as indicated by the ranges on the sidebar. |
|
|
|
Post by steve on Jun 5, 2009 13:38:40 GMT
Icefisher, I added this for clarification after posting the images:
The plot is from the Summary for Policy Makers AR4. They appear not to have plotted the A1F scenario. This is the "if you're really stupid and start digging those oil shales drilling those Arctic oil reserves, and knocking down more mountains in the Appalacians for a bit of coal" scenario.
Perhaps Akasofu has plotted it and I'm wrong. On the other hand though, he's chosen not to plot the B1 scenario which is an example of his selectiveness.
|
|
|
|
Post by hilbert on Jun 5, 2009 13:47:55 GMT
Here is a projection, with the May number included (for the US)  Is it fair to say that the projection is falsified? If not, at what point? More on topic, if Hansen et al. predict that ~ 10^22 J / yr are added to the OHC every year since the beginning of 2003, at what point is that prediction falsified (this assumes that the OHC does not rise much in the next few years)? If you are a supporter of AGW, at what point of discrepancy in the projection vs. measured OHC are you willing to say, "The projection is probably wrong." ? |
|
|
|
Post by icefisher on Jun 5, 2009 13:59:42 GMT
Icefisher, I added this for clarification after posting the images: The plot is from the Summary for Policy Makers AR4. They appear not to have plotted the A1F scenario. This is the "if you're really stupid and start digging those oil shales drilling those Arctic oil reserves, and knocking down more mountains in the Appalacians for a bit of coal" scenario. Its only stupid if CO2 is a problem. Perhaps Akasofu has plotted it and I'm wrong. On the other hand though, he's chosen not to plot the B1 scenario which is an example of his selectiveness. Maybe thats what he did. I don't know as I have not read the document. Maybe what he did was take the mainstream prediction (based upon labratory estimates) and added it to the ice age recovery. At any rate I would avoid picking around the edges as there may be a rationale for what you are seeing. |
|
|
|
Post by hilbert on Jun 5, 2009 14:04:34 GMT
from Climate Science: Climate Progress has a weblog by Joesph Romm titled “Breaking: NOAA puts out “El Niño Watch,” so record temperatures are coming and this will be the hottest decade on record“.
This is an interesting and very bold forecast of record temperatures by Joe Romm, and, if this does occurs, it would substantially support his claims on the dominance of human-caused global warming. Only time will tell, of course, if this warming will occur.
However, unfortunately, he still does not understand that i) the appropriate metric to monitor global warming involves heat in Joules, most which occurs in the oceans (e.g. see), and ii) that the accumulation Joules in the upper ocean has not occurred since 2003 (e.g. see and see). Even Jim Hansen agrees that the ocean is the dominant reservoir for heat accumulation (e. g. see). Here is the link: climatesci.org/2009/06/05/comment-on-joe-romms-weblog-on-el-nino-and-global-warming/ |
|
|
|
Post by magellan on Jun 5, 2009 16:41:01 GMT
from Climate Science: Climate Progress has a weblog by Joesph Romm titled “Breaking: NOAA puts out “El Niño Watch,” so record temperatures are coming and this will be the hottest decade on record“.
This is an interesting and very bold forecast of record temperatures by Joe Romm, and, if this does occurs, it would substantially support his claims on the dominance of human-caused global warming. Only time will tell, of course, if this warming will occur.
However, unfortunately, he still does not understand that i) the appropriate metric to monitor global warming involves heat in Joules, most which occurs in the oceans (e.g. see), and ii) that the accumulation Joules in the upper ocean has not occurred since 2003 (e.g. see and see). Even Jim Hansen agrees that the ocean is the dominant reservoir for heat accumulation (e. g. see). Here is the link: climatesci.org/2009/06/05/comment-on-joe-romms-weblog-on-el-nino-and-global-warming/Joe Romm, since he disagrees with this, should present other observational analyses of the continued accumulation of heat content in Joules since 2003. He should also focus on this time period since the Argo network was established, as it is this data network which is providing us more accurate assessments of the heat content in the upper ocean than is found in the earlier data. Note the very large jump (largest in the entire record) from 2002 to 2003 in OHC. This is where the old data was spliced with ARGO. Isn't it ironic the more accurate the measurements, albeit still not that great, the less it supports the CO2 AGW hypothesis (Hansen et al 2005) concering OHC? Nevertheless, its time to move on and ignore such inconvenient observations. Such it is with irrefutable hypotheses. |
|
|
|
Post by nautonnier on Jun 5, 2009 16:48:37 GMT
from Climate Science: Climate Progress has a weblog by Joesph Romm titled “Breaking: NOAA puts out “El Niño Watch,” so record temperatures are coming and this will be the hottest decade on record“.
This is an interesting and very bold forecast of record temperatures by Joe Romm, and, if this does occurs, it would substantially support his claims on the dominance of human-caused global warming. Only time will tell, of course, if this warming will occur.
However, unfortunately, he still does not understand that i) the appropriate metric to monitor global warming involves heat in Joules, most which occurs in the oceans (e.g. see), and ii) that the accumulation Joules in the upper ocean has not occurred since 2003 (e.g. see and see). Even Jim Hansen agrees that the ocean is the dominant reservoir for heat accumulation (e. g. see). Here is the link: climatesci.org/2009/06/05/comment-on-joe-romms-weblog-on-el-nino-and-global-warming/IF there is an El Nino (and lots of people like glc are rooting for one  ) then all that will do is further reduce the heat content of the oceans. El Nino is only the warm surface water slopping back to the West coast of the americas in a Kelvin wave then by convection and evaporation warming the atmosphere increasing convection in the Hadley cells and altering the weather patterns in the area. ALL that ENERGY is sucked out of the Pacific which means that unless SoCold and Steve's pipeline full of heat suddenly appears, the Pacific will get cooler still. From the global heat content point of view an El Nino is a COOLING event even though the atmosphere will have a short spike of temperature as the heat is transported from the Pacific ocean to space. In fact one could see an El Nino as a negative feedback  |
|


 ) then all that will do is further reduce the heat content of the oceans. El Nino is only the warm surface water slopping back to the West coast of the americas in a Kelvin wave then by convection and evaporation warming the atmosphere increasing convection in the Hadley cells and altering the weather patterns in the area. ALL that ENERGY is sucked out of the Pacific which means that unless SoCold and Steve's pipeline full of heat suddenly appears, the Pacific will get cooler still.