|
|
Post by nonanon on Nov 5, 2008 0:01:15 GMT
They need never admit that it's cooling, right up to the time the glaciers arrive near major US cities. NASA GISS routinely cooks the numbers to show warming where there is none, underplaying the role of the Urban Heat Island effect on monitoring stations and making unexplained adjustments to those records. Was the warmest year in the 1930s or was it in the 1990s? It depends on which temp record you look at, so it will be easy for Hansen et al to pretend the warming is still continuing if they wish. If we do face a return of our current ice age, there is no weapon in our arsenal that can stop it, certainly not CO2 no matter how much we produce since the IPCC and others ignore the fact that after saturation, more CO2 has almost zero impact on temp. I expect a lot more panic of advancing glaciers than we've seen over AGW hysteria but it won't help at all.
|
|
|
|
Post by nonanon on Nov 5, 2008 0:05:08 GMT
Tom and Norpag, I'm not sure if I've forgotten how to read a chart but AMSU's shows a modest drop in temp, from 29.12 to 29.05 at altitude 3,300 feet on Oct 15. A drop as you mention is physically impossible barring the sudden loss of all solar radiation. discover.itsc.uah.edu/amsutemps/execute.csh?amsutemps+001 |
|
Derek
New Member

Posts: 1
|
Post by Derek on Nov 6, 2008 21:51:13 GMT
|
|
|
|
Post by nautonnier on Nov 9, 2008 9:02:56 GMT
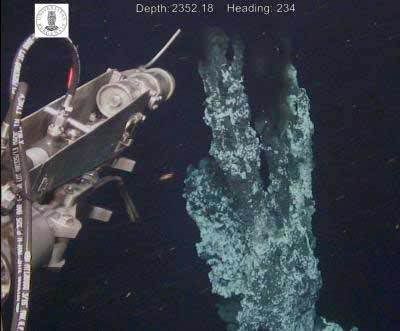
"So far, researchers have assumed that explosive volcanism cannot happen in water depths exceeding 3 kilometres because of high ambient pressure."But surely if the 'scientific consensus' was that this type of eruption cannot happen - it is 'settled science' so this volcano obviously does not exist in reality. These results need to be corrected
|
|
|
|
Post by solartrack on Nov 10, 2008 17:26:29 GMT
|
|
|
|
Post by vukcevic on Nov 30, 2008 14:38:31 GMT
Although I tend to believe there is a link between intensity of solar activity and climate, many dispute it. If however such link does exist (providing my assessment shown in this graph is correct) we are heading for 20-30 years of cooling.  Approximation for the overall amplitude's envelope is given by equation : Y= 60 [2 + COS (3pi/2 + 2pi(t-T0)/ 4S) + 0.5 COS (2pi(t-T0)/3( 4J+S+JS))] where To = 1941, J =11.86, JS = 19.85, S = 29.65 A=60 and B=2 are the normalising coefficients. The above equation gives prediction for SC24 around 80 depending on actual timing of the maximum (further away it falls, lower it is going to be). see graph etc on xxx.lanl.gov/ftp/astro-ph/papers/0401/0401107.pdf (pages 2 and 3) |
|
|
|
Post by Ole Doc Sief on Dec 1, 2008 3:59:49 GMT
WELL! That map explains everything, why those Global warming people must all live in Maryland! ;D |
|
|
|
Post by woodstove on Dec 1, 2008 19:19:27 GMT
WELL! That map explains everything, why those Global warming people must all live in Maryland! ;D GISS has two locations, one in New York City on Columbia's campus, and the second in Maryland. And, by golly, both spots are in the pink on the map. Not that they ever take a peak out the window to see what's going on on outside. ;D |
|
|
|
Post by tilmari on Dec 1, 2008 20:32:41 GMT
I sent this today to climatesceptics at Yahoo. It contains some material already appeared here, but now they are shortened and here in one place. Added are the SNs and 10.7 cm flux (adj. to 1 AU) plus HADCRUT and Sodankylä (Finland Lappland rural place) temps.
--------------------------------------------------------------------------------
Hi all,
November was the second month in row when the Sun rised its activity with cycle 24 spots. The solar hibernation from July to September with SN from 0.5 to 1.1 rose in October to a value of 2.9, which equals the January to June level with SN from 2.1 to 3.4 excepting the March which had an SN of 9.3 (cycle 23 (last?) burst). In November the value rose to 4.1 and first time all monthly values came from cycle 24. The value is also above the values from September to November 2007, but still lower than December 2007 (and March 2008).
The sunspot group 1007 that occurred on the 30th of October lasted 8 days ending only in the 6th of November thus lasting almost as long as the group 1005 in October (6 days). After only a 3 day break there appeared the spot group 1008 on 10th of November, which also lasted 8 days ending on the 17th of November. Now we have had 13 spotless day after that in November, the break in October lasted 12 spotless days in a row. The ppm(max) was 70 for group 1005, and 80 for groups 1007 and 1008.
We can thus almost be sure that the cycle 23 has ended, but despite the fact that the cycle 24 has clearly started, the rise has been so slow, that we can be pretty sure that the cycle will be very low, which in the past always has meant a colder climate.
Still we are on the course that 210 years ago led to Dalton minimum. However that does not necessarily lead to such a minimum, the coming minimum can be deeper, a Dalton-level or a bit higher. But not much, so say many other indicators in the Sun. The Sun has an approximately 200 year cycle, which in the data 1749-2008 has a peak at about 210 years if measured by autocorrelation.
So it’s time again to make a comparison with the years 1797-1798, just preceding the Dalton minimum (month spotnumber / month spotnumber adjusted-to-1-AU-10.7cm-flow):
1797: / 2007:
01 14 / 03 05 71
02 04 / 04 04 72
03 04 / 05 12 76
04 04 / 06 12 76
05 07 / 07 10 74
06 11 / 08 06 70
07 04 / 09 02 67
08 06 / 10 01 67
09 06 / 11 02 68
10 07 / 12 10 76
1798: / 2008:
11 06 / 01 03.4 71
12 03 / 02 02.1 69
1798: / 2008:
01 02 / 03 09.3 72
02 04 / 04 02.9 70
03 12 / 05 02.9 69
04 01 / 06 03.1 68
05 00 / 07 00.5 68
06 00 / 08 00.5 67
07 00 / 09 01.1 67
08 03 / 10 02.9 67
09 02 / 11 04.1 68
10 02 /
11 12 /
12 10 /
So there has been not even a temporary rise in the flux value after January 2008 and the values are the same reached already in September-October 2007.
Hadcrut3 temperature values here on Earth:
(baseline 1961-1990)
Global:
2001 0.41
2002 0.46
2003 0.47
2004 0.45
2005 0.48
2006 0.42
2007 0.40
2008 0.32 (from January to October)
cooling from 2005 0.16 degrees C
Oceans (SST):
2001 0.34
2002 0.38
2003 0.41
2004 0.38
2005 0.38
2006 0.34
2007 0.28
2008 0.25 (from January to October)
cooling from 2003 0.16 degrees C
Sodankylä in Finnish Lappland (degrees C)
2001 -0.5
2002 -0.5
2003 0.4
2004 0.4
2005 1.5
2006 0.6
2007 0.8
2008 0.6 last 12 months (December 2007-November 2008)
Answers I have given during November in the solarcycle24 blog:
Q: What is ahead?
A: The Sun glided into a chaotic phase between 1996.4-1996.8. The SSN in May 2000 was 121. So was cut the row of high maxima of cycle 21 and 22 with SSN 165 and 159. Actually this level had continued from the 1940's. Correcting the Jovian disturbance for cycles 19 and 20 (both had their minima 0.8 years after the Jovian perihelion) by taking the mean SSN for them as 156 and adding the maximum for the cycle 18 with SSN=152, the level dropped now from the 160 level with 25%.
This is connected to the Gleissberg cycle, which waited with its minimum in 2005.8. The Gleissberg minimum cannot go below 72 years, so that was the last chance for cycle 23 to give way to the cycle 24. But then the cycle 23 would have lasted only 9.4 years which was not possible for a cycle which had already waisted 4 years to climb from minimum to maximum.
So the cycle 23 had to continue, which changed the direction of the Gleissberg cycle from shortening to lenghtening. The shortening had began from the cycle 4, the cycle just before the Dalton minimum. The previous lengthening had began with cycle minus 9, just the cycle that began the Maunder Minimum.
In this way I leave the answer open. The past is not always a good basis for prediction, but sometimes it is.
Q: What do you see as the symptoms that would reverse the low trend in the Sun and cooling climate on Earth?
A: If the phenomenon that Penn and Livingston found (no sunspots in 2015 if the recent trend continues), reverse, if Ap index drop in 2005 will be temporary, if the solar conveyor belt gets a bit more speed, if the Gleissberg cycle has enough capability to say, this is enough, if that happens before the cycle change 23/24 is too near Jovian perihelion, if the TSI has an unexpected reverse from its downward trend (from 2005 continuous decrease below any observed during the satellite measurements since 1979), if the solar wind increases (2008 has had a 50 years mean low), then there are possibilities for decent cycles 24 and 25. But in case cows do not fly (at least a Finnish proverb), the cycles 24 and 25 are below Dalton level and the cooling of the Earth continues.
Q: How does the recent behaviour of the Sun compare how it has earlier behaved?
A: Every now and then there is a change in the mood of the Sun. Without going too far in the past I classify the most recent moods and their influence on our temperature as follows:
1645-1699 Maunder Minimum, virtually no spots for 55 years. Increasing cold here on Earth, the coldest period at least in 400 years, the coldest decade was the 1690's. The longer the minimum lasted, the colder it there was. Justin Schove has found similar occasions in the centuries AD200 and AD600, no spots, very cold.
1700-1766 Recovering Sun. Period begins most probably with a long cycle (13.5 years) and continues with only slightly disturbed cycles (estimated length 10.8 years).
1766-1856 Restless Sun. Begins with two ultrashort cycles (about 9 years) which give for some years at least in the 1770's and at least in the Northern Europe temperatures achieved next only in the 1930's. According to 10Be measurements the 1770's is the least cloudy (most sunny) decade after 1700. Then follows the long cycle (13.6 years), which leads to Dalton Minimum (1798-1823, cold temperatures between 1801 and 1820). Oscillation continues to 1856.
1856-1913 Jovian dominated Sun. Of the five cycles 4 have a length of one Jupiter year. Colder than after 1913 and partly during the latter part of the 1700's.
1913-1996 Sun on its own. With one exception the cycles last as near 10.3 years as the circumstances allow (more appropriate measure methods would show this more clearly). Also the last cycle (cycle 22) is somehow disturbed in 1996. Warm, warmest in the 1930's and about 1985-2005. There are indications that the 1930’s were warmer than the later period. The 1945-1975 period equals quite well with the 1770’s at least in Uppsala, which I have used as a baseline on many occasions (not however after 1990 when UHI destroyed the continuity of one of the oldest and most reliable series of measurements (set up by Celsius himself in the first part of 1700’s)). The heavy spottiness (I mean SSN(max) about 160) gives the possibility to warm climate, but as above in many posts have clearly been shown, PDO (at least) modulates effectively the end result.
1996- Sun is in trouble in thinking how to behave now (more seriously: different influences upon Sun conflict with each other at the moment). On Earth the changing mood is seen as cooling. Oceans began to cool after 2003, atmosphere from 2005.
Timo
|
|
|
|
Post by douglavers on Dec 4, 2008 20:25:45 GMT
According to the AMSU satellites, we are now about 0.48 F Warmer than this time last year.
This has happened very suddenly in the last 2-3 weeks.
Western Russia seems extremely warm, which might account for this.
However, this still begs the question of how [why?] these short term changes occur. Other areas seem very cold cf Western Europe, US & China.
|
|
pkatt
New Member
Posts: 28
|
Post by pkatt on Dec 4, 2008 21:08:52 GMT
I think a bit of the temps flux can be explained by the jetstream. squall.sfsu.edu/crws/jetstream.htmlIt has been dipping south and swinging up past the east coast, meanwhile quite a bit of central and western US gets a south flow from Artic areas. Im no expert, but it could explain temp variations with warmer and cooler air being transported N to S and S to N. For me it seemed to fit well into why the polar ice to the rt of greenland is having such a hard time forming. As for what the sun is doing. Just as the earth is subject to the external influence of the sun, the sun is most likely subject to the external influences of our galaxy or even our closest neighbors. Is there any cosmic event in our path around our galaxy that would explain our solar cycles? We pretty much dont know that. We are but a grain of sand in the grand scheme of things, thats why people who say they can explain how to fix climate make me giggle. |
|
|
|
Post by magellan on Dec 5, 2008 0:43:38 GMT
Might as well bring this up again: www.worldclimatereport.com/index.php/2008/12/03/rethinking-observed-warming/#more-351“Evidence is presented that the recent worldwide land warming has occurred largely in response to a worldwide warming of the oceans rather than as a direct response to increasing greenhouse gases (GHGs) over land.” As it took many years to accumulate heat in the ocean, so shall it be on the way down. There will be months where the oceans belch up heat and release it to space. That it will refuse to cooperate with AGW time lines as presented in IPCC AR4 is the conundrum for warmologists. Now they discover AGW can in fact have ten or even twenty years with no warming or even cooling, except they say when it stops warming . Ask them for any evidence of such periods in IPCC (the repository of knowledge for 2500 of the world's top scientists). ;D |
|
|
|
Post by jorgekafkazar on Dec 5, 2008 4:45:41 GMT
[trimmed] We are but a grain of sand in the grand scheme of things, thats why people who say they can explain how to fix climate make me giggle. Reminds me of the late night radio announcer who got a call from a woman who said she'd discovered she could change the shape of the Aurora Borealis by waving her tablecloth at it. He started to laugh and couldn't stop, the idea was so ridiculous. Someday, scientists will all laugh at the notion that men and farting livestock could influence the Earth's climate. |
|
|
|
Post by alex4ever on Dec 7, 2008 19:47:21 GMT
Quite Surprising for me to see so many votes in a big YES in this poll.  |
|
|
|
Post by slh1234 on Dec 8, 2008 14:42:45 GMT
[trimmed] We are but a grain of sand in the grand scheme of things, thats why people who say they can explain how to fix climate make me giggle. Reminds me of the late night radio announcer who got a call from a woman who said she'd discovered she could change the shape of the Aurora Borealis by waving her tablecloth at it. He started to laugh and couldn't stop, the idea was so ridiculous. Someday, scientists will all laugh at the notion that men and farting livestock could influence the Earth's climate. On the issue of livestock: I've always found it funny that the same people who complain about cattle grazing on public land farting and blowing holes in the ozone layer or warming up the globe always bemoan the fact that there are not so many bison on the plain in the US. It is true that bison herds were once huge. But I guess they don't think a buffalo fart does the same thing as cattle farts? |
|