|
|
Post by duwayne on Jul 3, 2018 18:04:08 GMT
Back in January, I predicted that the average UAH6 anomaly for the first half of 2018 would fall from the 0.63C level in October 2017 to 0.17C. The numbers are now in and the temperatures did not fall quite that far. They fell by 0.41C to a 0.22C average rather than the 0.46 fall I predicted.
Earlier I noted that I’ve learned my lesson and I’m not going to try to predict to the hundredths of a degree accuracy in the future since that gets me into trouble. To the nearest tenth of a degree my prediction would have been a fall from 0.6C in October 2017 to 0.2C average for the first half of 2018. That is what happened.
I’ll also note that several years ago I predicted that the yearly record 1998 UAH anomaly of 0.48C wouldn’t be broken before 2037 because the ocean currents would be in a cooling trend from 2007 to 2037. However, the 2016 anomaly was 0.51C and at that time I noted that my prediction was not correct because of the 0.03C higher temperature.
Had I predicted that the anomaly would not go above the 1998 record of 0.5C, I would have been correct. So, to the nearest tenth of a degree my predictions have all been good.
|
|
|
|
Post by acidohm on Jul 3, 2018 19:43:03 GMT
Back in January, I predicted that the average UAH6 anomaly for the first half of 2018 would fall from the 0.63C level in October 2017 to 0.17C. The numbers are now in and the temperatures did not fall quite that far. They fell by 0.41C to a 0.22C average rather than the 0.46 fall I predicted. Earlier I noted that I’ve learned my lesson and I’m not going to try to predict to the hundredths of a degree accuracy in the future since that gets me into trouble. To the nearest tenth of a degree my prediction would have been a fall from 0.6C in October 2017 to 0.2C average for the first half of 2018. That is what happened. I’ll also note that several years ago I predicted that the yearly record 1998 UAH anomaly of 0.48C wouldn’t be broken before 2037 because the ocean currents would be in a cooling trend from 2007 to 2037. However, the 2016 anomaly was 0.51C and at that time I noted that my prediction was not correct because of the 0.03C higher temperature. Had I predicted that the anomaly would not go above the 1998 record of 0.5C, I would have been correct. So, to the nearest tenth of a degree my predictions have all been good. Duwayne...full credit, this thread is 10 years old (there was another on 'the old' forum). You were there making predictions even then 👍👍 |
|
|
|
Post by nautonnier on Aug 27, 2018 12:02:38 GMT
|
|
|
|
Post by duwayne on Aug 27, 2018 16:32:53 GMT
Nautonnier, do you know if the temperatures referred to by Bastardi are global temperature averages and if they are available somewhere online? |
|
|
|
Post by nautonnier on Aug 27, 2018 18:17:12 GMT
Nautonnier, do you know if the temperatures referred to by Bastardi are global temperature averages and if they are available somewhere online? Duwayne, if you click on the image twice you will get an expanded view. They are NCEP images and global and CONUS anomalies in turn - I should think you will be able to find them on NCEP's site. |
|
|
|
Post by mondeoman on Aug 27, 2018 19:12:02 GMT
|
|
|
|
Post by missouriboy on Aug 28, 2018 0:08:26 GMT
Well, it doesn't seem to get it right for the center of the North American continent. Perhaps you need to know the super secret handshake. 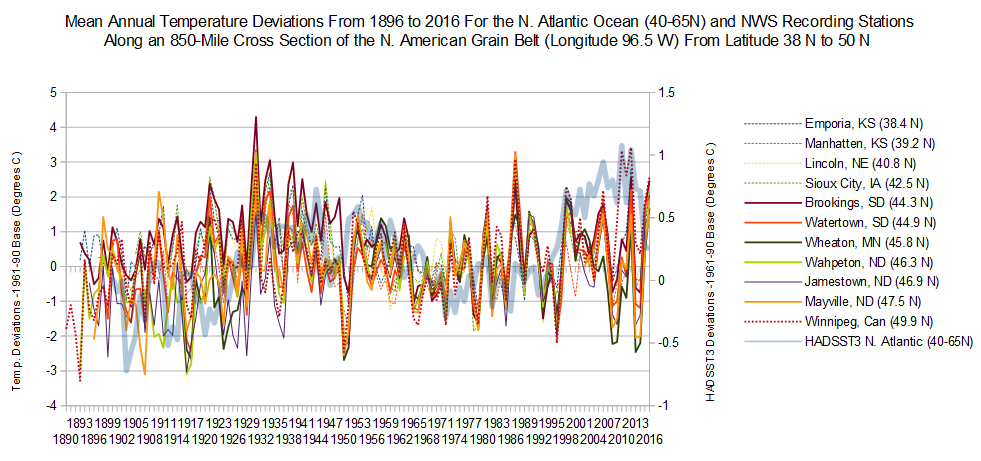 |
|
|
|
Post by Ratty on Aug 28, 2018 0:32:20 GMT
Well, it doesn't seem to get it right for the center of the North American continent. Perhaps you need to know the super secret handshake. Nor for central Western New South Wales: 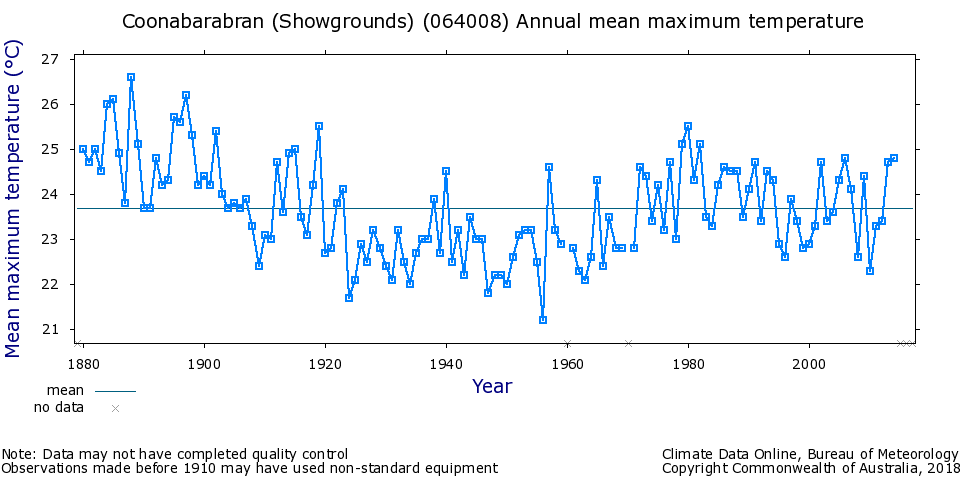 |
|
|
|
Post by acidohm on Sept 1, 2018 15:58:54 GMT
|
|
|
|
Post by sigurdur on Sept 7, 2018 13:35:20 GMT
|
|
|
|
Post by missouriboy on Sept 7, 2018 21:31:00 GMT
Anybody read this yet. 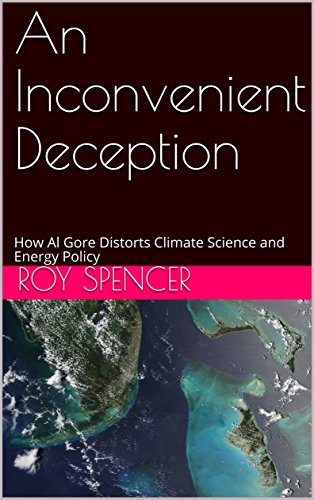 |
|
|
|
Post by Ratty on Sept 7, 2018 23:00:53 GMT
|
|
|
|
Post by Ratty on Sept 7, 2018 23:03:35 GMT
Wind and solar farms are known to have local effects on heat, humidity and other factors that may be beneficial—or detrimental—to the regions in which they are situated. A new climate-modeling study finds that a massive wind and solar installation in the Sahara Desert and neighboring Sahel would increase local temperature, precipitation and vegetation. Overall, the researchers report, the effects would likely benefit the region.More precipitation = more clouds = less solar output? 
|
|
|
|
Post by nautonnier on Sept 10, 2018 20:47:49 GMT
"Global Temperature Report: August 2018 – Global Temp cooling a bit to +0.19 from +0.31 in July."
August Temperatures (preliminary)
Global composite temp.: +0.19 C (+0.34 °F) above seasonal average
Northern Hemisphere.: +0.15 C (+0.27°F) above seasonal average
Southern Hemisphere.: +0.10 C (+0.18 °F) above seasonal average
Tropics.: +0.12 C (+0.22 °F) above seasonal average
July Temperatures (final)
Global composite temp.: +0.32 C (+0.58 °F) above seasonal average
Northern Hemisphere.: +0.42 C (+0.76°F) above seasonal average
Southern Hemisphere.: +0.21 C (+0.38 °F) above seasonal average
Tropics.: +0.29 C (+0.52 °F) above seasonal average
wattsupwiththat.com/2018/09/10/global-temperature-report-august-2018-global-temp-cooling-a-bit-to-0-19-from-0-31-in-july/
|
|
|
|
Post by nautonnier on Sept 11, 2018 9:36:27 GMT
https:// =removespace= twitter.com/NoTricksZone/status/1039199871629238272?s=20 |
|


