|
|
Post by blustnmtn on May 5, 2019 13:29:07 GMT
|
|
|
|
Post by walnut on May 5, 2019 13:39:40 GMT
Castor knows that AGW is real, because she personally was hit by a hurricane.
|
|
|
|
Post by blustnmtn on May 5, 2019 15:11:47 GMT
Castor knows that AGW is real, because she personally was hit by a hurricane. One of the countless useful idiots. |
|
|
|
Post by nautonnier on May 5, 2019 16:06:32 GMT
I understand the approach but the night time temperatures will be held high (high minimums) as the vast areas of concrete/tarmac and even relatively short grass are like a rocky landscape. This changes the heat profile considerably and with the undergrad 'averaging' of Max Temp and Min Temp, can lead to effects that are hidden in the averaging of means. It would be interesting to know more, eg how many times any one station is polled in 24 hours. HINT: Somebody with a better grasp of methodologies might like to take it up with the TG site? FWIW, they are currently reporting above normal: Current Temperature: 61.17°F (16.21°C) Current Deviation: 3.97°F (2.21°C) above normal12M Avg Temperature: 56.25°F (13.47°C) 12M Avg Deviation: 0.95°F (0.53°C) below normal 2015 average: 0.98 °F (0.54 °C) below normal 2016 average: 0.48 °F (0.27 °C) below normal 2017 average: 0.47 °F (0.26 °C) below normal 2018 average: 1.33 °F (0.74 °C) below normal Stations processed last hour: 60090 Last station processed: Hong Kong, Hong Kong Update time: 2019-05-05 00:31:42 UTC They are using METARS these are hourly aviation weather reports see bcaws.aviationweather.gov/metarIf conditions change rapidly particularly items like it starts to snow or the cloud base or visibility reduce to a level that will require instrument approaches then a report will be issued called a SPECI(al METAR). In the past the reporting was done by Met Observers at the airports and without them by the Air Traffic Control officers at the airport. However, the days of an observer muffling up and going out into the gale force sleet to read instruments in the Stevenson screen are long gone. Almost all airports now have automated systems such as Automated Weather Observing System (AWOS) and the more sophisticated Automated Surface Observing System (ASOS) see www.skybrary.aero/index.php/Automated_Weather_Observing_System_%28AWOS%29These are automated systems and are continually sensing the temperatures, humidity, cloud base, visibilities etc., The formal reports METARS are only required once an hour and SPECIs when the parameters of a specific value require a special report. It is totally possible for a real average temperature (or better yet a real average heat content) to be created. However, that would limit the 'adjustments' and fudging available to climatologists so they continue taking the mathematical mean of the highest temperature and the lowest temperature and calling that the 'average' temperature. This in my view is not only incorrect it is blatantly dishonest - as one would expect from climate 'scientists' as they have no ethics. ADDITION Note although the METARS are reports of an airport microclimate that can be significantly different from an equivalent area of open countryside - from an aviation point of view this is not a problem as the actual weather state at the airport is what is required, not an accurate climatological report. So if the air over the runway with sun on it is 10C higher than the grassy fields surrounding the airport the aircraft need the 10C higher figure as that is what affects their engine power output. |
|
|
|
Post by duwayne on May 5, 2019 18:07:08 GMT
[[But looking at the PDO over the multi-decal 30 year period of 1977-2007 when the AMO was going from its cool minimum to its warm peak, the PDO was also “net warm” with a 30-year average of 0.7. (I’m using the latest updated PDO values that Missouriboy was kind enough to provide a link to.)]] I don't know whether it was a co-incidence, but I think 1977 to 2007 also represented a large peak of solar activity. Possibly its most active period in the last 8,000 years. This has now reversed, co-inciding with The AMO and PDO moving to "cool". Duwayne, what do you think this will do to global temperatures when the current weak El Nino fades? Douglavers, I expect UAH anomalies of around 0.2C when ENSO is neutral. Here is a chart showing solar activity over time. People have tried to show that solar activity drives (correlates with) global temperatures, but it's hard to make the case that solar activity is the major driver. That being said there is no doubt that solar activity has some effect which could be significant if, for example, solar activity drops to very low levels for a multi-decadal period. |
|
|
|
Post by duwayne on May 5, 2019 18:34:32 GMT
The AMO and the PDO are Different Metrics
The AMO is a true temperature metric (whether raw or detrended). The PDO is an ocean temperature distribution metric. When the AMO goes negative it means that surface water temperature anomalies have gone cold relative to the long-term mean. When the PDO goes negative it means that warmer waters are spatially concentrated in the Western Pacific versus the East. It says nothing about what overall North Pacific surface temperature is doing relative to a long term average. It would be useful to have an AMO-equivalent PDO index. DOES the North Pacific Ocean have surface temperature cycles equivalent to the North Atlantic? The PDO does however seem to generally run in sync with ENSO. 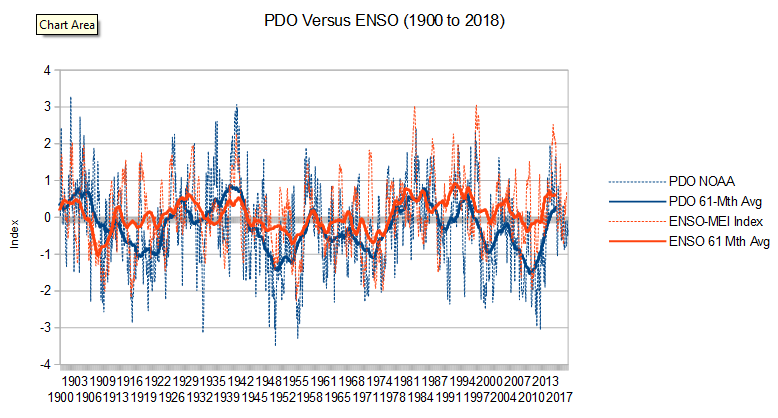 Missouriboy, you say above that "When the PDO goes negative it means that warmer waters are spatially concentrated in the Western Pacific versus the East." Are you saying that the PDO value calculations (not detrended) are dependent on the temperature differential between the western and eastern Pacific? |
|
|
|
Post by nonentropic on May 5, 2019 18:43:44 GMT
Naut I have watched that site for a year or two and in my view so long as you use an identical method always from an identical number of sites and the sites remain the same it could show trends and change.
Long term there will be problems but interesting all the same.
The average moves above and below the annual due in my mind to the difference between the two hemispheres.
Regardless an honest attempt I think to show the global ebb and flow of temperatures through the years.
|
|
|
|
Post by icefisher on May 6, 2019 1:22:31 GMT
The AMO and the PDO are Different Metrics
The AMO is a true temperature metric (whether raw or detrended). The PDO is an ocean temperature distribution metric. When the AMO goes negative it means that surface water temperature anomalies have gone cold relative to the long-term mean. When the PDO goes negative it means that warmer waters are spatially concentrated in the Western Pacific versus the East. It says nothing about what overall North Pacific surface temperature is doing relative to a long term average. It would be useful to have an AMO-equivalent PDO index. DOES the North Pacific Ocean have surface temperature cycles equivalent to the North Atlantic? The PDO does however seem to generally run in sync with ENSO. Its interesting but the PDO more than affecting the distribution of heat in the Pacific Ocean also is correlated to natural cooling and warming patterns seen in global temperature records. I think this is consistent with Nautonnier's concept of climate change. The Pacific Ocean is by far the largest ocean and something over 90% of all absorbed solar heat ends up in the oceans either by sunshine directly on the oceans which make up about 3/4's of the planet surface or by runoff from the melting of snows and heat absorbed in the atmosphere via precipitation. I haven't actually done any work on that statement but see it popup from time to time with numbers as high as 93%. Land heat absorption is very low because of its opaqueness to all wavelengths of light. Any heat on land has to conduct downwards and because thats purely a electromagnetic absorption process the heat comes out every day. Nautonnier has argued at length that temperature is the wrong metric that instead accumulated heat needs to be measured and then one can begin to find the cause of climate change. I agree with Naut. So what is the effect of the PDO? warm waters in the west make for warm air above but the oceans aren't measured by air in the surface record but instead by buoys and ship intakes. Only on land does the "surface" record actually measure the temperature of the air. Warm waters in the east also make for warm air and the same issue. The difference is that the prevailing wind direction is west to east and thus warm waters in the east will influence greatly onshore thermometers at weather stations. So while the entire North Pacific is averaging out based on averaging the regional water temps western shores of the pacific are unmolested by the PDO while the eastern shores are changed. Basically an error induced by the temperature measuring strategy as far as global warming is concerned. I think that James Hansen discovered this some years ago, mid to late 2000's, because he changed his homogenization algorithms regarding ocean influences on the land and replaced it with algorithm that favored land influence on the oceans. This is in hand with general philosophy of the climate change science community that regional differences occur and don't matter. But what would matter would be overly egotistical scientists who believe they can adjust for it accurately. The alarmist community being unaware in the early 90's that the PDO even existed where caught with their pants down in projecting upcoming warming. Not only too much on the heels of a blossoming warm PDO but they probably over compensated for it by trying to correct for it without any real data, except for the satellites which were showing less warming measuring air temperatures consistently and not water temperatures over the oceans. I just invented this theory like 5 minutes ago so take it with a grain of salt. What is true is how they are measuring global temperatures and that James Hansen did change his algorithms for homogenization at GISTEMP as GISTEMP was not performing like the models said they should. So depending upon how you define climate the PDO might not be climate change but it definitely is to fishermen. Even now on the heels of the huge 2015 El Nino for which "surface" waters have not fully returned to normal and a minor El Nino is underway. . . .fishermen in the eastern Pacific are catching salmon many miles south of where they have in a long time. . . .I think pretty much since the 1970's and the last cool PDO. That biological measure was in place a decade ago and only briefly interrupted by the 2014 to 2015 El Nino and its delayed effects and of course during all that time we had Graywolf in here telling us constantly how positive the PDO was during that time. Blob, Son of Blob, etc. And which temperature record is now the coldest trend since I think the mid 2000's? Its UKMETs which has been rather cool ever since 2003. Even cooler than UAH. So it seems likely the PDO and AMO need to be looked at for explanations of mid-term length climate change. I am far less versed on the AMO. But it does seem somewhat connected to the extent of arctic ice and I have that theory of an ice cycle in chain with the thermohaline circulation system accelerating downwelling of very cold brines when ice extents are low which may in someway (like believed for ENSO) be connected changes in wind patterns. And of course the goof early on in the middle of PDO induced false warming (at least from a heat content point of view) caused a landslide of money and today hardly anybody with a job in any kind of research even remotely connected to climate, if anybody, wants to slay the goose that lays the golden egg. |
|
|
|
Post by missouriboy on May 6, 2019 3:18:25 GMT
The AMO and the PDO are Different Metrics
The AMO is a true temperature metric (whether raw or detrended). The PDO is an ocean temperature distribution metric. When the AMO goes negative it means that surface water temperature anomalies have gone cold relative to the long-term mean. When the PDO goes negative it means that warmer waters are spatially concentrated in the Western Pacific versus the East. It says nothing about what overall North Pacific surface temperature is doing relative to a long term average. It would be useful to have an AMO-equivalent PDO index. DOES the North Pacific Ocean have surface temperature cycles equivalent to the North Atlantic? The PDO does however seem to generally run in sync with ENSO. Missouriboy, you say above that "When the PDO goes negative it means that warmer waters are spatially concentrated in the Western Pacific versus the East." Are you saying that the PDO value calculations (not detrended) are dependent on the temperature differential between the western and eastern Pacific? As I understand it yes. Which reflects the fisheries issues that gave rise to it. As discussed by Icefisher in past posts. |
|
|
|
Post by Ratty on May 6, 2019 4:08:09 GMT
[ Snip ] I just invented this theory like 5 minutes ago ..... [Snip ] So, you ARE a climate scientist !  PS: How is your paper coming along? |
|
|
|
Post by duwayne on May 6, 2019 17:53:16 GMT
Missouriboy, you say above that "When the PDO goes negative it means that warmer waters are spatially concentrated in the Western Pacific versus the East." Are you saying that the PDO value calculations (not detrended) are dependent on the temperature differential between the western and eastern Pacific? As I understand it yes. Which reflects the fisheries issues that gave rise to it. As discussed by Icefisher in past posts. Missouriboy, the link below says "The PDO Index is calculated by spatially averaging the monthly sea surface temperature (SST) of the Pacific Ocean north of 20°N. The global average anomaly is then subtracted to account for global warming (Mantua, 2000)." ffden-2.phys.uaf.edu/645fall2003_web.dir/Jason_Amundson/pdoindex.htmI read that to say that the PDO relects the overall average temperature of the northern Pacific ocean rather than a differential between the eastern Pacific and the western Pacific. The reference then goes on to say "When the PDO Index is positive, waters in the north central Pacific Ocean tend to be cool, and waters along the west coast of North America tend to be warm. The opposite is true when the PDO Index is negative (Null, 2002)." |
|
|
|
Post by douglavers on May 7, 2019 2:25:05 GMT
Jo Nova enjoying herself. joannenova.com.au/Scroll down to article on Albany, WA. Quality control is a foriegn language to the BOM. |
|
|
|
Post by missouriboy on May 7, 2019 3:09:02 GMT
As I understand it yes. Which reflects the fisheries issues that gave rise to it. As discussed by Icefisher in past posts. Missouriboy, the link below says "The PDO Index is calculated by spatially averaging the monthly sea surface temperature (SST) of the Pacific Ocean north of 20°N. The global average anomaly is then subtracted to account for global warming (Mantua, 2000)." ffden-2.phys.uaf.edu/645fall2003_web.dir/Jason_Amundson/pdoindex.htmI read that to say that the PDO relects the overall average temperature of the northern Pacific ocean rather than a differential between the eastern Pacific and the western Pacific. The reference then goes on to say "When the PDO Index is positive, waters in the north central Pacific Ocean tend to be cool, and waters along the west coast of North America tend to be warm. The opposite is true when the PDO Index is negative (Null, 2002)." Warm Phase Cool Phase 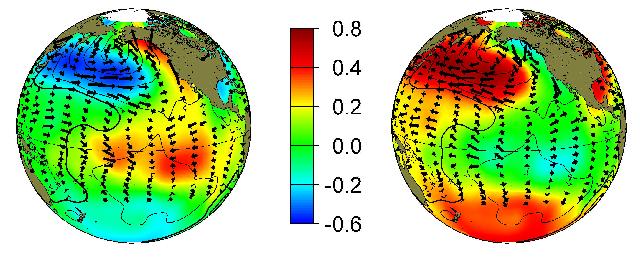 |
|
|
|
Post by icefisher on May 10, 2019 4:16:49 GMT
[ Snip ] I just invented this theory like 5 minutes ago ..... [Snip ] So, you ARE a climate scientist ! PS: How is your paper coming along? Actually its coming along pretty well. Just that I have had to work for the last few weeks and haven't had time for it. However, I think I have the full paper written in draft form. May have to split it up though as its getting a little long. |
|
|
|
Post by phydeaux2363 on May 23, 2019 18:34:13 GMT
|
|


