|
|
Post by icefisher on Mar 29, 2015 16:53:24 GMT
Interesting article in Jo Nova about Stephen Wilde's theory on ozone and troposphere: Is the Sun driving ozone and changing the climate?The interesting part comes at the end (spoiler alert  )
"Quick reminder: The delay of one sunspot cycle in the ND theory overcomes the objection that because TSI and so on peaked around 1986 and surface temperatures kept rising to about 1997, the Sun cannot be driving temperature. The delay can explain this: 1986 + 11 = 1997. The delay also means that the fall off in bulk TSI around 2004 presages a fall in surface temperatures around about one sunspot later, around 2017: 2004 + 13 = 2017. The “pause” the believers of the carbon crisis have lately admitted to may turn out to be a “plateau”Yet another support for precisely what Theo has been telling us. The solar cycle is definitely good for a delay as shown by this chart of how warming trends have changed with the solar cycle progression. 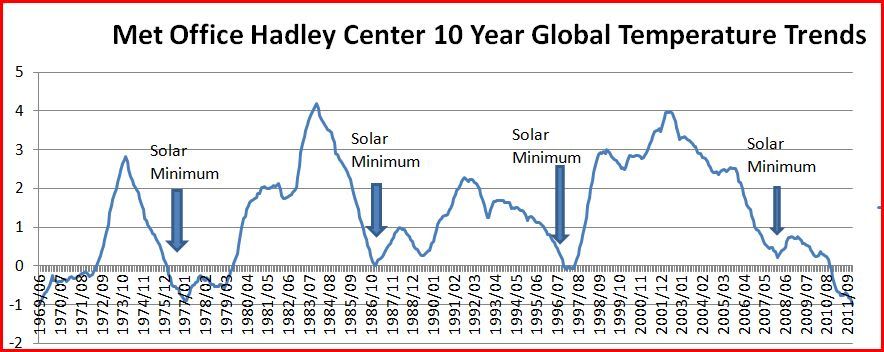 However, the speculation of the delay being a full solar cycle might be a bit simplistic. Clearly upper ocean mixing plays into the formula and the fact that the current solar cycle where the max is just now playing out was good for "recent average" solar activity almost perfectly matching the pause. However, if one were to include the Maunder Minimum in the sunspot count for an average (its not for recent average) the current maximum cycle was well above the average of the entire sunspot count record that goes back to the early 17th century. The graphic above would suggest that significant cooling would come with the next solar minimum but how much might be tied very tightly to how strong the next cycle is because it seems warming kicks in pretty strongly at the very beginning of solar awakening. I don't know if its the sunspots that create the warming with their high energy emissions or if the sunspots are just another manifestation of the actual cause. |
|
|
|
Post by sigurdur on Apr 1, 2015 17:20:34 GMT
|
|
|
|
Post by duwayne on Apr 30, 2015 16:25:41 GMT
The March Hadcrut4 global temperature anomaly is now available, so here is the update on my global warming prediction from 2007. The prediction is described in detail in many posts on this thread over the past 8 years. The "Predicted" column is the predicted average for 2007 through 2037 and the "To_Date" column is the actual average for 2007 through March of 2015. My prediction was that global temperatures would be flat over the 2007-2037 year period at the 2007 trend temperature determined by a least-squares trend of global temperature anomalies over the 1977-2007 period. The Multivariate ENSO (MVENSO) and the Pacific Decadal Oscillation (PDO) which have a 60-year cycle were projected to be similar to the last cool cycle in 1947-1977.
| Predicted
| To_Date
| Difference
| Hadcrut4 Anomaly
| 0.52C
| 0.49C
| -0.03C
| MVENSO
| -0.3
| -0.2
| +0.1
| PDO
| -0.6
| -0.4
| +0.2
|
Global temperatures anomalies so far are running very close to the predicted values. Up until a few months ago the MVENSO and PDO were right on target. But both have warmed in recent months. My expectation is that both of these measures will turn negative in due time bringing them back in line with the prediction. As I've noted before, a super La Nina is to be expected sometime during the first several years of the cool Ocean cycle phase. |
|
|
|
Post by acidohm on Apr 30, 2015 17:56:44 GMT
The March Hadcrut4 global temperature anomaly is now available, so here is the update on my global warming prediction from 2007. The prediction is described in detail in many posts on this thread over the past 8 years. The "Predicted" column is the predicted average for 2007 through 2037 and the "To_Date" column is the actual average for 2007 through March of 2015. My prediction was that global temperatures would be flat over the 2007-2037 year period at the 2007 trend temperature determined by a least-squares trend of global temperature anomalies over the 1977-2007 period. The Multivariate ENSO (MVENSO) and the Pacific Decadal Oscillation (PDO) which have a 60-year cycle were projected to be similar to the last cool cycle in 1947-1977.
| Predicted
| To_Date
| Difference
| Hadcrut4 Anomaly
| 0.52C
| 0.49C
| -0.03C
| MVENSO
| -0.3
| -0.2
| +0.1
| PDO
| -0.6
| -0.4
| +0.2
|
Global temperatures anomalies so far are running very close to the predicted values. Up until a few months ago the MVENSO and PDO were right on target. But both have warmed in recent months. My expectation is that both of these measures will turn negative in due time bringing them back in line with the prediction. As I've noted before, a super La Nina is to be expected sometime during the first several years of the cool Ocean cycle phase. Hi Duwayne , just out of interest, what techniques do you use for your long range forecasting? |
|
|
|
Post by nautonnier on Apr 30, 2015 18:44:47 GMT
An interesting discussion of potential cooling from E.M.Smith 'Chiefio' ..... "Then they make a “sop” to our “stable” Holocene climate. Well, it WAS stable for 10,000 years (modulo that Younger Dryas thing…) and we are now back into an insolation regimen much closer to that quasi-stable phase. I would assert that we are presently IN a metastable state, and the Little Ice Age was an example of that. Next “dip” will be worse. (No, not opinion. Based on how the orbital mechanics are slowly and inexorably taking us to ever less heat up North and into the next Real Ice Age Glacial. It simply must, by definition be worse next time.) " |
|
|
|
Post by flearider on May 1, 2015 10:44:28 GMT
and I must say they don't like people posting there thoughts .. deleted ...
|
|
|
|
Post by duwayne on May 1, 2015 18:41:02 GMT
The March Hadcrut4 global temperature anomaly is now available, so here is the update on my global warming prediction from 2007. The prediction is described in detail in many posts on this thread over the past 8 years. The "Predicted" column is the predicted average for 2007 through 2037 and the "To_Date" column is the actual average for 2007 through March of 2015. My prediction was that global temperatures would be flat over the 2007-2037 year period at the 2007 trend temperature determined by a least-squares trend of global temperature anomalies over the 1977-2007 period. The Multivariate ENSO (MVENSO) and the Pacific Decadal Oscillation (PDO) which have a 60-year cycle were projected to be similar to the last cool cycle in 1947-1977.
| Predicted
| To_Date
| Difference
| Hadcrut4 Anomaly
| 0.52C
| 0.49C
| -0.03C
| MVENSO
| -0.3
| -0.2
| +0.1
| PDO
| -0.6
| -0.4
| +0.2
|
Global temperatures anomalies so far are running very close to the predicted values. Up until a few months ago the MVENSO and PDO were right on target. But both have warmed in recent months. My expectation is that both of these measures will turn negative in due time bringing them back in line with the prediction. As I've noted before, a super La Nina is to be expected sometime during the first several years of the cool Ocean cycle phase. Hi Duwayne , just out of interest, what techniques do you use for your long range forecasting? Acidohm, In paragraphs 3 and 4 above I show how I calculated my predicted values. All you need are the historical values for the Hadcrut4 anomalies and the MVENSO and PDO. Past posts on this thread describe the rationale behind my forecasts. I'll post something in the next day or so when I get time which resummarizes my rationale. |
|
|
|
Post by duwayne on May 1, 2015 19:36:39 GMT
The March Hadcrut4 global temperature anomaly is now available, so here is the update on my global warming prediction from 2007. The prediction is described in detail in many posts on this thread over the past 8 years. The "Predicted" column is the predicted average for 2007 through 2037 and the "To_Date" column is the actual average for 2007 through March of 2015. My prediction was that global temperatures would be flat over the 2007-2037 year period at the 2007 trend temperature determined by a least-squares trend of global temperature anomalies over the 1977-2007 period. The Multivariate ENSO (MVENSO) and the Pacific Decadal Oscillation (PDO) which have a 60-year cycle were projected to be similar to the last cool cycle in 1947-1977.
| Predicted
| To_Date
| Difference
| Hadcrut4 Anomaly
| 0.52C
| 0.49C
| -0.03C
| MVENSO
| -0.3
| -0.2
| +0.1
| PDO
| -0.6
| -0.4
| +0.2
|
Global temperatures anomalies so far are running very close to the predicted values. Up until a few months ago the MVENSO and PDO were right on target. But both have warmed in recent months. My expectation is that both of these measures will turn negative in due time bringing them back in line with the prediction. As I've noted before, a super La Nina is to be expected sometime during the first several years of the cool Ocean cycle phase. Do you maintain a website where you post your predictions? Or where would we find them in detail? I'm very, very interested in the PNW. Also would like to know do you concur with Astro Code, What is PNW? I don't have a public website. I maintain a private one to maintain a record of my predictions in case the Cycle24 site is taken down some time in the future. My predictions and their rationale are detailed in past posts on this thread and a thread of the same name which preceded this one but is no longer shown on the site. I'll post a resummary of the important points of my predictions and rationale here in a day or so. I don't have an opinion on the methodology behind Astro's predictions. I do admire anyone who spells out his predictions and accurately follows up on the progress. My predictions are perhaps more specific than Astro's with respect to global temperatures trends through the end of the century but he is more specific with respect to the beginning of an unusually cold period (2017). I expect a super La Nina in the next few years since the last Ocean Current cycle was dominated by La Ninas and these cycles tend to repeat in general every 60 years. |
|
|
|
Post by sigurdur on May 2, 2015 2:56:47 GMT
Code, What is PNW? I don't have a public website. I maintain a private one to maintain a record of my predictions in case the Cycle24 site is taken down some time in the future. My predictions and their rationale are detailed in past posts on this thread and a thread of the same name which preceded this one but is not longer shown on the site. I'll post a resummary of the important points of my predictions and rationale here in a day or so. I don't have an opinion on the methodology behind Astro's predictions. I do admire anyone who spells out his predictions and accurately follows up on the progress. My predictions are perhaps more specific than Astro's with respect to global temperatures trends through the end of the century but he is more specific with respect to the beginning of an unusually cold period (2017). I expect a super La Nina in the next few years since the last Ocean Current cycle was dominated by La Ninas and these cycles tend to repeat in general every 60 years. Thanks for the reply. The PNW is the Pacific Northwest sorry I didn't make that clear. I also agree El Nino and La Nina come in cycles but I'm skeptical of the long global cooling Astro predicts. I think a La Nina is bound to happen but if one shows up and it's strong it might be interpreted by some as proof global cooling is happening. I believe AGW will probably affect the climate later in the century. Code: Look at paelo data. CO2 continues to rise as temperatures rapidly drop. I think the huge mistake that the proponents of CO2 induced AGW are making is in the sensitivity of the climate to CO2. Paleo data actually indicates it is strongly negative over time. |
|
|
|
Post by icefisher on May 2, 2015 18:48:52 GMT
Code, What is PNW? I don't have a public website. I maintain a private one to maintain a record of my predictions in case the Cycle24 site is taken down some time in the future. My predictions and their rationale are detailed in past posts on this thread and a thread of the same name which preceded this one but is not longer shown on the site. I'll post a resummary of the important points of my predictions and rationale here in a day or so. I don't have an opinion on the methodology behind Astro's predictions. I do admire anyone who spells out his predictions and accurately follows up on the progress. My predictions are perhaps more specific than Astro's with respect to global temperatures trends through the end of the century but he is more specific with respect to the beginning of an unusually cold period (2017). I expect a super La Nina in the next few years since the last Ocean Current cycle was dominated by La Ninas and these cycles tend to repeat in general every 60 years. Thanks for the reply. The PNW is the Pacific Northwest sorry I didn't make that clear. I also agree El Nino and La Nina come in cycles but I'm skeptical of the long global cooling Astro predicts. I think a La Nina is bound to happen but if one shows up and it's strong it might be interpreted by some as proof global cooling is happening. I believe AGW will probably affect the climate later in the century. Its good to be skeptical of Astromet's predictions. The problem with astrometeorology is the same as the problem with the models. Nobody has a reliable grip on the dynamics of oceans and atmospheres. Astrometeorology is not built on science but is instead built on logic and mathematics. While logic and mathematics is an important element of science it is not science as science, particularly of global systems and of biology are truly in their infancy. The logic of the astrometeorologic system is built on inductive logic that observations of the past will be identical to observations in the future, but that was another world in the past. We have more CO2 today that what was known in the past, or at least assuming ice core data is correct. So the inductive logic of astrometeorology has a definite chance of failure. I tend to agree with Astromet that CO2 does not warm the surface appreciably, and I also believe that CO2 is not responsible for entire so-called greenhouse effect. But we have no proof one way or the other that such beliefs are correct. It seems almost implausible to me that CO2 causes both its effect and the effect of water so I have zero faith in the models and all the morons that follow them around like people once listened to witch doctors. What we have today is a lot of witch doctors who happen to have been awarded degrees. But any brown noser with sufficient financial resources and enough time and effort can get awarded a degree and that basically was the primary method of rising to witch doctor in the past as well. |
|
|
|
Post by duwayne on May 2, 2015 21:12:15 GMT
As promised, here’s a summary of my global warming prediction and the rationale. Pretty much everything is from previous posts. I’ll do the summary in 2 or 3 posts. I’ve labeled and numbered paragraphs for reference purposes.
First, some background……
1) Most scientists, including many labeled as skeptics, agree that CO2 is a greenhouse gas and with all other things being equal will, before any feedbacks, cause global temperatures to increase by about 1.0C per doubling of atmospheric concentration. I’ll refer to this as the “direct” CO2 climate sensitivity.
2) Scientists, including skeptics, agree that as a result of “direct” warming there will be “feedback” effects. But there is wide disagreement on what the feedback will be.
The models selected by the IPCC show a “likely” feedback range of 0.5 to 3.5C per doubling of CO2 after equilibrium is reached. Note the top end of the range is 7 times the low end and the IPCC admits the actual value could fall outside this range. Actual temperatures are consistent with feedbacks below even the low end of the IPCC range.
3) Why can’t the feedbacks be accurately estimated using models? It’s because key variables such as ocean currents, winds and clouds cannot be accurately modeled due to an extreme shortage of key scientific knowledge.
The IPCC Models don’t give us accurate answers, but fortunately there’s another way…….
1) If you want to estimate how fast a person can run, you could try to model the physical processes involved in running and model the outcome. Or you just have the person run as fast as they can, and time them. That, of course, is a quite accurate method which avoids the pitfalls and shortfalls of modeling.
2) In the case of global warming we are fortunate that we have some good information on how fast the earth warms when atmospheric CO2 increases rapidly. That’s been happening for 70 years .
So my prediction is based on an analysis of the earth’s response to a growing level of CO2 in the atmosphere. I’ll describe more about the analysis and the rationale in the next post.
|
|
|
|
Post by icefisher on May 3, 2015 1:57:01 GMT
2) In the case of global warming we are fortunate that we have some good information on how fast the earth warms when atmospheric CO2 increases rapidly. That’s been happening for 70 years . I would very strongly dispute there is any significant information regarding number 2. When you have an free variable (feedback) that is designed to account for everything you get wrong no matter how much or how little, does any information matter? At any rate I thought the current IPCC climate sensitivity range was 1.5C to 4.5C a range of 3 not 7, except some observation analysis suggests it could be as low as .35 giving a range of 13. Whichever is correct such an estimated range that large says very loudly we haven't hardly any information to start with. At any rate, I will be interested in your analysis. |
|
|
|
Post by duwayne on May 3, 2015 17:29:28 GMT
2) In the case of global warming we are fortunate that we have some good information on how fast the earth warms when atmospheric CO2 increases rapidly. That’s been happening for 70 years . I would very strongly dispute there is any significant information regarding number 2. When you have an free variable (feedback) that is designed to account for everything you get wrong no matter how much or how little, does any information matter? At any rate I thought the current IPCC climate sensitivity range was 1.5C to 4.5C a range of 3 not 7, except some observation analysis suggests it could be as low as .35 giving a range of 13. Whichever is correct such an estimated range that large says very loudly we haven't hardly any information to start with. At any rate, I will be interested in your analysis. Icefisher, thanks for your comments. The question I'm working on is how much will global temperatures increase with rapidly increasing CO2. The point I am making in 2) is we don't have to approach this question relying on inaccurate General Circulation Models (GCM) since the earth has been running the "experiment" (for want of a better word)for 70 years under conditions which are totally realistic (They are reality.). We have a pretty good idea how much atmospheric CO2 has increased over these 70 years and we have a pretty good idea how much temperatures have increased because of the increase in CO2 and other reasons. My prediction is based on an analysis of that information rather than GCMs. After I describe my analysis later, I hope you will provide comments. With regard to your comment on climate sensitivities, perhaps I wasn't clear with respect to my statements. The 1.5 to 4.5C per doubling of CO2 I referred to is the total climate equilibrium sensitivity per IPCC. It is the total of the "direct" sensitivity plus "feedback". There is general agreement among scientists dating back many years that the direct climate sensitivity portion is about 1.0. The remainder is the feedback portion. Subtracting the 1.0 direct portion from both the IPCC low end estimate and the high estimate we get a range for the GCM feedback portion of 0.5 to 3.5C which is a significant self-admitted inaccuracy. And as you say others believe for good reason that the feed back is even below the low end of the IPCC range. |
|
|
|
Post by nonentropic on May 3, 2015 19:47:15 GMT
Duwayne the issue of other variables still sits in my mind. Solar cycles, Fe depletion of oceans and many other as yet undetermined issues.
That's not say that I don't like your approach.
The Hiatus indicates that other variables are significant but also agree that they should average out so long as we have an adequate time span and don't cherry pick start and finish dates.
|
|
|
|
Post by Ratty on May 3, 2015 22:01:26 GMT
Duwayne wrote: "We have a pretty good idea how much atmospheric CO2 has increased over these 70 years and we have a pretty good idea how much temperatures have increased because of the increase in CO2 and other reasons."
Agree.
|
|


 )
)


