|
|
Post by missouriboy on Aug 24, 2016 2:18:58 GMT
MB, the GISS doom graph is anomalies. Yours is mean temps. Can you make any direct comparison for this ill-equipped reader? Be gentle ..... Anomalies are just differences from a baseline mean. Normally they are used because the changes are too small to be readily visible when charting the parent statistic. You merely compress the range of data to be displayed. Hence, you can turn a mole hill into a mountain ... but it does not change the magnitude of the relationship between data points. In this case, the temperatures are so blatantly obvious that deviations are not required. Even anomalies will not help the NASA deviants with this one.  However ... check the 'Change in the American Grain Belt' thread as I will be posting a version of these as deviations for comparison with HADSST3 deviations. |
|
|
|
Post by Ratty on Aug 24, 2016 7:36:59 GMT
Thanks.
|
|
|
|
Post by sigurdur on Sept 17, 2016 21:30:14 GMT
|
|
|
|
Post by Ratty on Sept 18, 2016 0:10:47 GMT
So, sediment cores indicate an historic tendency to (very) prolonged drought but GHGs will make the current drought "15 to 25 percent" worse. I wonder how that range of worsening was calculated? From the study: Was this worth publishing?
|
|
|
|
Post by missouriboy on Sept 18, 2016 1:57:41 GMT
So, sediment cores indicate an historic tendency to (very) prolonged drought but GHGs will make the current drought "15 to 25 percent" worse. I wonder how that range of worsening was calculated? Was this worth publishing? SWAG ... and NO. |
|
|
|
Post by sigurdur on Sept 28, 2016 21:05:38 GMT
www.ecowatch.com/earth-record-temperatures-2020710545.htmlEarth is the warmest it's been in 100,000 years, a new reconstruction of historical temperature data finds, and with today's level of fossil fuel emissions the planet is "locked into" eventually hitting its highest temperature mark in 2 million years.
|
|
|
|
Post by icefisher on Sept 28, 2016 21:34:43 GMT
www.ecowatch.com/earth-record-temperatures-2020710545.htmlEarth is the warmest it's been in 100,000 years, a new reconstruction of historical temperature data finds, and with today's level of fossil fuel emissions the planet is "locked into" eventually hitting its highest temperature mark in 2 million years. "We do find this close relationship between temperature and greenhouse gases that is remarkably stable, and what the study is developing is the coupling factor between the two," Snyder told National Geographic. Translation: She used climate models. |
|
|
|
Post by Ratty on Sept 28, 2016 22:31:46 GMT
www.ecowatch.com/earth-record-temperatures-2020710545.htmlEarth is the warmest it's been in 100,000 years, a new reconstruction of historical temperature data finds, and with today's level of fossil fuel emissions the planet is "locked into" eventually hitting its highest temperature mark in 2 million years. Maybe. Maybe not:  |
|
|
|
Post by nautonnier on Sept 29, 2016 11:21:49 GMT
www.ecowatch.com/earth-record-temperatures-2020710545.htmlEarth is the warmest it's been in 100,000 years, a new reconstruction of historical temperature data finds, and with today's level of fossil fuel emissions the planet is "locked into" eventually hitting its highest temperature mark in 2 million years. Maybe. Maybe not: I think I am on the maybe not side. Has this 'researcher' rewritten the Holocene temperatures? Has she not learned of the Eemian interglacial? This is the kind of rubbish that should be rejected at peer review with an - explain the basis of your overturning all the previous studies in geology. But of course universities want the research funding. Funding is far more important than ethics. |
|
|
|
Post by duwayne on Oct 19, 2016 19:29:29 GMT
In 2007 I predicted the 60-Year Ocean Current Cycle was entering its 30 year Cool Phase and as a result global temperatures would on average be flat over the 2007-2037 period despite the warmist warnings that the earth would warm significantly. So far the average temperatures have been flat. I also predicted that ENSO (as measured by the Multivariate ENSO technique) and the PDO would be similar to the readings of the last 30-year Ocean Current Cool Phase. A little over a year ago the MVENSO and PDO average readings were right on target. The recent super El Nino , however, has pushed the readings considerably above my predictions. Quarterly Update: 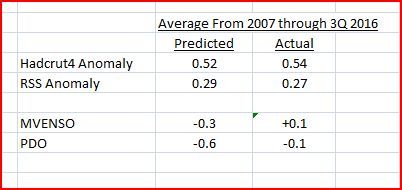 |
|
|
|
Post by duwayne on Nov 11, 2016 19:19:18 GMT
Some of you who are longer term posters may remember when Zaphod awarded me a gold star for uncovering the Met Office’s surreptitious downward revision of their decadal global warming forecast in an apparent attempt to hide the fact that global temperatures had flattened. Here is an article from the Daily Mail on that event which in paragraph 6 mentions an “eagle-eyed climate blogger” (that’s me) who discovered the Met Office shenanigans. www.dailymail.co.uk/news/article-2261577/Global-warming-stopped-16-years-ago-Met-Office-report-reveals-MoS-got-right-warming--deniers-now.htmlAnd here is another article from the Guardian which puts a name to the “eagle-eyed climate blogger”. Scroll down to the subheading “Welcome to the Eco Audit” and read the second paragraph. www.theguardian.com/environment/blog/2013/jan/09/global-warming-met-office-pausedI used Zaphod’s gold star for my avatar for a while. Also, at the end of this year we’ll be 10 years into my 30-year forecast of flat global temperatures for 2007-2037. It is looking like my prediction at year-end will be 0.02C too high for the RSS anomaly and 0.02C too low for the Hadcrut4 anomaly. Averaging these two, the prediction error will be 0.00C. I wanted to highlight these successess because another prediction I made several years ago may be wrong and I didn’t want my credibility to totally collapse. I predicted that the Global temperature satellite anomaly record high in 1998 would not be surpassed before the year 2037 due to the cool ocean current phase. For 17 years the anomaly has remained comfortably below the 1998 record, but there is a chance it will be broken this year. The 2016 anomaly through October is 0.06C above the 1998 level. There is still a chance that November and December will be cool enough for the old record to hold, but the record is clearly in jeopardy. Also, be forewarned that if the 1998 record is surpassed, I’ll try to wriggle off the hook with the excuse that the rate of growth in atmospheric CO2 concentration has accelerated and I did say in my prediction that it was based on a continuation of the growth rate from the early 2000’s. |
|
|
|
Post by sigurdur on Nov 11, 2016 20:48:41 GMT
We post in the presence of a star! Hat off to you Duwayne!
|
|
|
|
Post by nautonnier on Nov 11, 2016 23:02:59 GMT
Duwayne, All may not be lost quite yet...  A BIG drop after the election   |
|
|
|
Post by icefisher on Nov 11, 2016 23:34:02 GMT
Duwayne, All may not be lost quite yet... A BIG drop after the election that has to be a joke! |
|
|
|
Post by Ratty on Nov 11, 2016 23:46:56 GMT
Duwayne, All may not be lost quite yet... A BIG drop after the election that has to be a joke! Ebell already on the job. |
|


