|
|
Post by itsonlysteam on Mar 11, 2010 5:51:07 GMT
I've been avoiding this site for a couple days and now I'm back and the sun has a couple spots! Yeah. I am resigned to a Dalton Type Minimum and have convinced myself this is how it will play out but I am not prepared to accept anything worse  If you have to just color a couple spots on the disk next time. Thanks. |
|
|
|
Post by glc on Mar 11, 2010 9:09:40 GMT
I've been avoiding this site for a couple days and now I'm back and the sun has a couple spots! Yeah. I am resigned to a Dalton Type Minimum and have convinced myself this is how it will play out but I am not prepared to accept anything worse If you have to just color a couple spots on the disk next time. Thanks. I wouldn't worry about it. According to the CET trecord temperatures actually increased slightly during the Dalton Minimum (1798-1820). They did fall before the Dalton Minimum though. However, if SC23 is supposed to be equivalent to SC4 (the long cycles) then temperatures should have already hit the bottom. You can comfort yourself in the knowledge that UAH has just recorded the warmest July-Feb period (by a mile) in the satellite record - and we look to be well on the way to the warmest continuous 12 month period on record. |
|
|
|
Post by nautonnier on Mar 11, 2010 10:30:45 GMT
You can tell it has been extremely hot by the extreme snows and crop failures.
I think that what we are seeing is the failure of the simplistic 'average' as a metric - perhaps with other ordering errors or even map projection errors and misassumptions included.
It would be far more useful to have the ocean and atmospheric heat content calculated.
|
|
|
|
Post by northsphinx on Mar 11, 2010 10:55:39 GMT
According to the CET trecord temperatures actually increased slightly during the Dalton Minimum (1798-1820). They did fall before the Dalton Minimum though.  CET from Cru  And CET on wiki  And solar cycles  Notice anything?  |
|
|
|
Post by aj1983 on Mar 11, 2010 14:11:23 GMT
Yeah. It looks a bit like a seismic graph superimposed on a trend.
|
|
|
|
Post by glc on Mar 11, 2010 19:06:22 GMT
Notice anything?
Yes I've noticed that
1. The smoothed sunspot number peaked in around 1960 and that the CET temperatures have departed from your trend line in the past 25 years or so.
2. There was a local maximum in about 1730 but cooling after that despite increased sunspot numbers.
3. There's a very sharp dip around 1740 - which is probably related to a volcanic eruption
4. There seems to be 3 sharp dips between 1780 and 1820. The third of these in the mid-1810s is probably due to the Tambora eruption.
Apart from that I haven't noticed anything much.
|
|
|
|
Post by hunter on Mar 11, 2010 22:04:12 GMT
What this shows is that climate science offers many opportunities for simplisitic- and incorrect- conclusions about relationships.
It also shows that temp records in many ways are useless.
To claim that the last year has been *warm* is to simply ask people to believe a lie.
The climate science AGW inspired cuisanart appraoch to data management is turning out completely worthless information.
|
|
|
|
Post by itsonlysteam on Mar 12, 2010 4:20:59 GMT
I'm with hunter. glc ... I simply can't reconcile the historical record and what you call temperature data. As a simple exercize which would probably frustrate hunter, I lined up the 172 year 'corrected' Jose cycle (2x Gleissberg et al) with historical events and the overlay is uncanny. If you do the 'lazy man' analysis (similar to AGW anti-empircal radiative theory) of a few papers and make the 'medieval maximum' the start for this cyclic phenomena and take it as a phase change in the barycenter of the solar system, we are in cycle 6 out of 8 and looking at the historical record we should get a 'mild' 'Dalton Type' solar grand minimum. Even some in the AGU using less 'arm chair supposition' and more science declare we are in a Dalton 'type' Grand Solar Minimum ( eventcg.com/clients/agu/fm09/U34A.html ... it's in the second presentation ). As far as the UAH is concerned when they declare its the warmest ever barbecue season on record and the Thames has frozen over ... whatever. I'm just waiting for a LaNina in a Cold PDO and Cold AMO without AO blocking. If that happens this winter like Bastardi expects ... well the snow everywhere and frigid cold in Siberia of this year will be a fond memory. They'll be glad they trucked snow to Cypress Mountain instead of the renewed Arctic Outflows as of 2008/9 in the Pacific Northwest. All I can say if this El Nino in a Cold PDO is an indication of how wonderful and warm its supposed to get when I experienced the single coldest day in my life this last December and the last time we had a 18 month El Nino there was no snow to Northwest Territories ... I'm still preparing for cold. It just better not be 'Maunder' type cold. 50 on this solar cycle would be sufficient. |
|
|
|
Post by magellan on Mar 12, 2010 5:13:23 GMT
I've been avoiding this site for a couple days and now I'm back and the sun has a couple spots! Yeah. I am resigned to a Dalton Type Minimum and have convinced myself this is how it will play out but I am not prepared to accept anything worse If you have to just color a couple spots on the disk next time. Thanks. I wouldn't worry about it. According to the CET trecord temperatures actually increased slightly during the Dalton Minimum (1798-1820). They did fall before the Dalton Minimum though. However, if SC23 is supposed to be equivalent to SC4 (the long cycles) then temperatures should have already hit the bottom. You can comfort yourself in the knowledge that UAH has just recorded the warmest July-Feb period (by a mile) in the satellite record - and we look to be well on the way to the warmest continuous 12 month period on record. So what makes the entire country of Germany any less relevant than CET, the official ordained Global Temperature Representative? 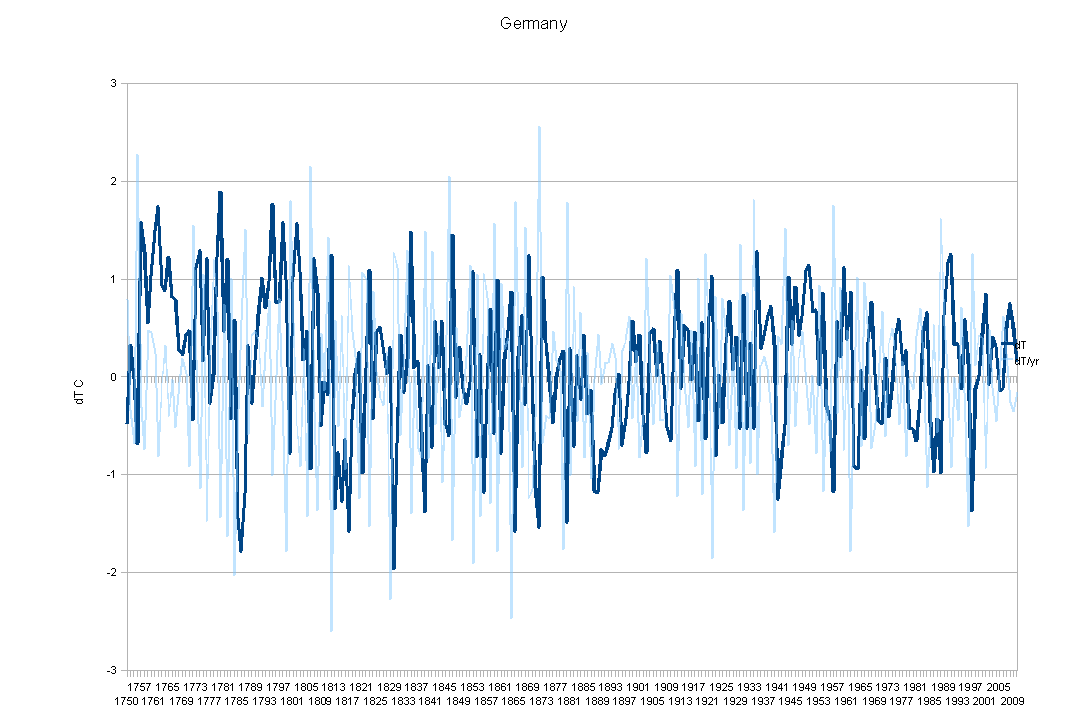 You can comfort yourself in the knowledge that UAH has just recorded the warmest July-Feb period (by a mile) in the satellite record - and we look to be well on the way to the warmest continuous 12 month period on record. What is the significance of that? Surely you understand the TLT is warmed from below, that being oceans? Are you suggesting this is CO2 at work? Surely you jest. Seriously, it really is puzzling how some folks still have no clue what's going on with the TLT temperatures with respect to ENSO. Geez, just look at all the temperature and heat metrics. The globe is not warming, it is releasing heat for gosh sakes! 2+2= I for one have insisted this El Nino would not pass 97/98 as the energy just isn't working in that direction, and lo and behold, it just can't seem to get over the hump. Don't despair. In another decade or so maybe then it will almost reach 2010. Recall the headlines in 2007.  |
|
|
|
Post by itsonlysteam on Mar 12, 2010 7:22:36 GMT
magellan,
I'd have to actually dig to find it but even the great ocean proponent ... William Gray said something to the effect that from what he sees the Oceans delay/muddle the solar forcing by about a decade. The cold AMO/PDO ... 30 year cycle ... 1/3 of Gleissberg which is half of Jose ... its a mess and the connecting of the different cycles has never gone mainstream so the work is crude but it is compelling.
|
|
|
|
Post by glc on Mar 12, 2010 9:28:36 GMT
Seriously, it really is puzzling how some folks still have no clue what's going on with the TLT temperatures with respect to ENSO. Geez, just look at all the temperature and heat metrics. The globe is not warming, it is releasing heat for gosh sakes!
2+2=You don't need to tell me about ENSO, Magellan. I made the point that ENSO (La Nina) was the reason for the 2008 'cooling' when everyone else on this blog was waffling on about the solar minimum nonsense (Have you deleted your posts where you were predicting plummeting temperatures at the end of 2008?) I do know that El Nino is boosting the LT temperatures but why is it boosting them so much. There have been a number of El Ninos during the history of the satellite record why haven't they produced similar spikes in LT temperature. The only comparable one was in 1998 - and that was a 2+ Sigma event, i.e. way off the scale of expectations. I for one have insisted this El Nino would not pass 97/98 as the energy just isn't working in that direction, and lo and behold, it just can't seem to get over the hump. Don't despair. In another decade or so maybe then it will almost reach 2010. This El Nino is not as strong as 1998 and whether or not temperatures exceed 1998 this time is not really relevant. We all thought 1998 was a rare one off. It now seems as though this might not be the case. More heat is being retained in the oceans than can be explained by any variation in solar activity. An increase in atmospheric ghgs will slow the rate of cooling from the oceans. The key observations will be in 3-5 years time. Temeprature will almost certainly fall back onece the El Nino has faded - but what then? Will a new background temperature level be established as happened in the last decade, so that the coming decade is ~0.2 deg warmer than the previous one. PS 1. I've no idea what your german graph is supposed to show. 2. I believe there is ony one, perhaps 2, german temperature records which go back as far as the 1750s so the graph can hardly be representative of the whole of Germany. 3. Most, if not all, long term records are in close agreement with the CET.
|
|
|
|
Post by nautonnier on Mar 12, 2010 9:38:13 GMT
Seriously, it really is puzzling how some folks still have no clue what's going on with the TLT temperatures with respect to ENSO. Geez, just look at all the temperature and heat metrics. The globe is not warming, it is releasing heat for gosh sakes!
2+2=You don't need to tell me about ENSO, Magellan. I made the point that ENSO (La Nina) was the reason for the 2008 'cooling' when everyone else on this blog was waffling on about the solar minimum nonsense. I do know that El Nino is boosting the LT temperatures but why is it boosting them so much. There have been a number of El Ninos during the history of the satellite record why haven't they produced similar spikes in LT temperature. The only comparable one was in 1998 - and that was a 2+ Sigma event, i.e. way off the scale of expectations. I for one have insisted this El Nino would not pass 97/98 as the energy just isn't working in that direction, and lo and behold, it just can't seem to get over the hump. Don't despair. In another decade or so maybe then it will almost reach 2010. This El Nino is not as strong as 1998 and whether or not temperatures exceed 1998 this time is not really relevant. We all thought 1998 was a rare one off. It now seems as though this might not be the case. More heat is being retained in the oceans than can be explained by any variation in solar activity. An increase in atmospheric ghgs will slow the rate of cooling from the oceans. The key observations will be in 3-5 years time. Temeprature will almost certainly fall back onece the El Nino has faded - but what then? Will a new background temperature level be established as happened in the last decade, so that the coming decade is ~0.2 deg warmer than the previous one. As I have posted before - perhaps the 'warming' is an artifact of the averaging metric. It can give undue weight to small changes in a skewed dataset, and skews could be exacerbated by relatively small erroneous assumptions in, or misuse of, mapping algorithms. |
|
|
|
Post by glc on Mar 12, 2010 9:56:20 GMT
As I have posted before - perhaps the 'warming' is an artifact of the averaging metric. It can give undue weight to small changes in a skewed dataset, and skews could be exacerbated by relatively small erroneous assumptions in, or misuse of, mapping algorithms.
Could you re-write the above in plain English. In particular
1. Explain which dataset is skewed and why.
2. What erroneous assumptions are being made and by whom?
3. In what way would, mapping algorithms be "misused" - and again by whom?
4. Finally, and perhaps more importantly, do you hve any idea what you're talking about?
|
|
|
|
Post by nautonnier on Mar 12, 2010 16:22:11 GMT
As I have posted before - perhaps the 'warming' is an artifact of the averaging metric. It can give undue weight to small changes in a skewed dataset, and skews could be exacerbated by relatively small erroneous assumptions in, or misuse of, mapping algorithms.Could you re-write the above in plain English. In particular 1. Explain which dataset is skewed and why. 2. What erroneous assumptions are being made and by whom? 3. In what way would, mapping algorithms be "misused" - and again by whom? 4. Finally, and perhaps more importantly, do you hve any idea what you're talking about? Well you obviously do not know what YOU are talking about. As a little primer on Climatological Averages and their problems I suggest that you read (I know that you won't but it would be good) : "Does a Global Temperature Exist?"www.uoguelph.ca/~rmckitri/research/globaltemp/GlobTemp.JNET.pdfThe skew in data is the huge variation in OATs that are being used as inputs into the unspecified 'averaging' . The errors and assumptions are to do with choice of averaging methods, choice of inputs into the methods etc etc. Mapping algorithms are a continual source of error in assessment of 'area' and 'distance' and as we have all seen fundamental erros being made by 'experts' (even as basic as mixing metric and imperial units when calculating trajectories) these supposedly simplistic areas bear being examined. ESPECIALLY as we are now in the rather paradoxical state of unexpected snow fall and cold weather in many areas of the NH that 'never' get snow simultaneous with being told that this is the warmest average global temperature period on record. When such mismatches occur scientists go back and check assumptions and methods and whether the process being used to generate metrics is actually appropriate or useful. |
|
|
|
Post by icefisher on Mar 12, 2010 17:00:20 GMT
I do know that El Nino is boosting the LT temperatures but why is it boosting them so much. There have been a number of El Ninos during the history of the satellite record why haven't they produced similar spikes in LT temperature. The only comparable one was in 1998 - and that was a 2+ Sigma event, i.e. way off the scale of expectations. Thats hilarious GLC! You think maybe one plausible explanation could be a warm ocean created by 50 years of relatively low GCRs resulting in lower than normal cloud cover which in turn results in a gradual heat build up in the oceans? You are asking why LT is so high. The answer seems obvious, namely that OHC is relatively high. GCRs are now high and if they continue to average what they have averaged over the past decade or decade and a half one might expect continued cooling of the ocean and resulting continued diminishing of LT temperature peaks. I for one have insisted this El Nino would not pass 97/98 as the energy just isn't working in that direction, and lo and behold, it just can't seem to get over the hump. Don't despair. In another decade or so maybe then it will almost reach 2010. This El Nino is not as strong as 1998 and whether or not temperatures exceed 1998 this time is not really relevant. We all thought 1998 was a rare one off. It now seems as though this might not be the case. More heat is being retained in the oceans than can be explained by any variation in solar activity. Huh? What does solar activity have to do with heat retention in the ocean? I thought heat was cast off relative to its surface temperature. Its warm and it is casting off heat warming the LT as would be expected from its heat content. If you want to make the argument that the ocean should have cooled by now you need some calculations of that. . . .but keep in mind that arguing a highly responsive ocean cuts the last shreds of the AGW theory asunder by denying a haven for the missing heat allegedly generated by ever increasing CO2 levels. No you can't argue that point GLC you have to take the Hansen point of view that the oceans are far bigger heat sinks than ever expected and the response really should be a lot slower than what LT drops indicate. . . .suggesting instead mysterious new currents from the depths denying the warming postulated by the AGW theory either being manifested in the atmosphere or the portion of the oceans monitored by the ARGO buoy system. The only problem with that argument is it leads us straight to Akasofu's .5C per century underlying LIA recovery being consistent with all we know about long term climate change. That had been discarded by the AGW advocates by virtue of the argument that recent warming could not be explained by natural causes. . . .therefore oceans releasing excess heat could not be an explanation for the "unusual" atmospheric warming we experienced between 1980 and 1998. Of course with Hansen how seeking refuge in the ocean for the missing heat that argument has gone up literally in smoke. . . .yet he continues to advocate the conclusions of that argument. Ultimately the real truth is that anybody who has been reading atmospheric thermometers for indications of AGW has effectively had their heads buried in the sand. The oceans rule the climate! Even Hansen now admits to that much. And since we have not been adequately measuring heat content of the oceans (the unusual 2003 temperature jump coinciding with the implementation of ARGO being evidence of that.) In fact, even now we may not be adequately monitoring it. In fact the AGW theory depends upon that being true. An increase in atmospheric ghgs will slow the rate of cooling from the oceans. The key observations will be in 3-5 years time. Temeprature will almost certainly fall back onece the El Nino has faded - but what then? Will a new background temperature level be established as happened in the last decade, so that the coming decade is ~0.2 deg warmer than the previous one. LOL! Did you wave your hands over a glass ball while you typed that GLC? Or did you just forget a question mark? I sense a hitch in your step. ROTFLMAO!! Since the only refuge for the AGW theory is the ocean its not likely you will see a .2C warming in the coming decade since by all known science the ocean is cooling not gaining heat to release later. After seeking refuge in the ocean you illogically expect some magic heat is going to bail you out. There is zero evidence to suspect a new higher background temperature level if the ocean is now cooling. All bets are off you can't look to the 80's and 90's for guidance because at that time the ocean was likely getting warmer which appears to be no longer the case. Of course it could be lurking in the deep deep; but isn't it likely that heat would stay there since there is no known physical mechanism for it to warm up the surface over the period of a decade. Its like Hansen attributes the missing heat to the tooth fairy and that the tooth fairy will then transport it back to the surface. All AGW science is about these days is extending trendlines across periods dominated by warm ocean cycles into the new cool regime and pretending to notice no erosion of their underlying assets. . . .just like a jaded credit default swap broker. Show me increasing OHC then I will give your speculations some degree of plausibility. It seems most plausible to me that we will see a resumption of some increases in OHC in perhaps a decade or more resulting in some natural warming for a stretch to bring us back on track with the average of .5deg C natural LIA recovery. And I doubt I could probably get excited about an extra .3C per century from a CO2 greenhouse effect pushing us along a bit quicker . . . .assuming of course it wasn't low GCRs producing the anemic cooling of the 50's, 60's and 70's and the more rapid warming of the 80's and 90's. That's especially true knowing it is probable that within a few more centuries we will get about a minus .5C per century natural forcing for some unknown number of centuries and all will then be singing the praises of the CO2 greenhouse effect. |
|


