|
|
Post by icefisher on Apr 17, 2010 14:26:11 GMT
If the planet cools the process of mind change will accelerate. Evidence of physical forcings on the mind!?! Just that some are stiffer, less adaptable, and slower than others. |
|
|
|
Post by socold on Apr 17, 2010 14:31:50 GMT
Is an ongoing background warming trend inconsistant with the data? Take HadCRUT3 since 1970 and add a blue exponential curve. The curve is engineered to reflect a rise that will reach about 3C by 2100. Overall the fit is quite good, the temperature data may indeed be following an exponential curve. 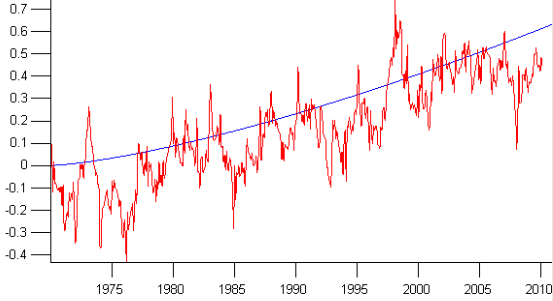 To replicate year to year variation, the ENSO index is added to the blue curve. This produces a result that looks closer to hadCRUT3: 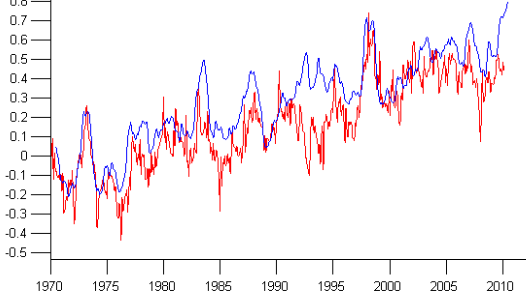 There are major differences though. In particular the early 1990s in HadCRUT3 is much lower than in the blue plot. This is expected as the blue plot doesn't take into account the effect the Pinatubo eruption in the early 90s. Factoring in cooling caused by volcanic eruptions greatly reduces the difference in the early 90s, and slightly reduces the difference in the early 80s due to the El Chichon eruption. Other periods are unaffected. 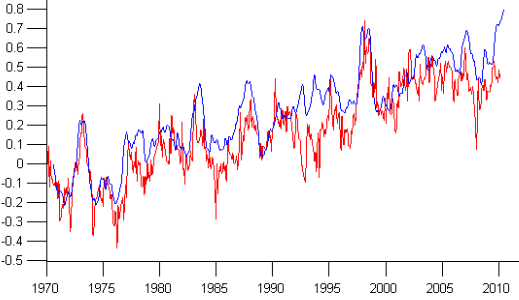 But there are still large differences. It appears that every 10 years the differences become greater... Removing the 11 year solar cycle reduces these differences greatly: 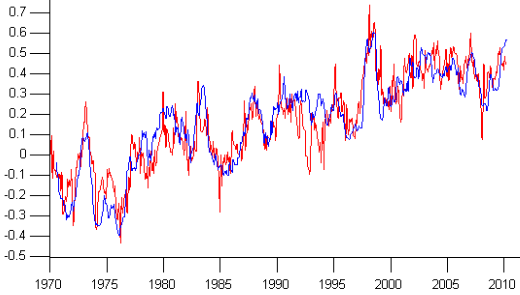 These variables suggest the flat temperature since 2003 in the HadCRUT3 record is due to the long solar minimum. Extrapolating these relationships into the future, by assuming solar cycle 24 will be significantly lower than recent ones and that ENSO variation will follow previous patterns yields: 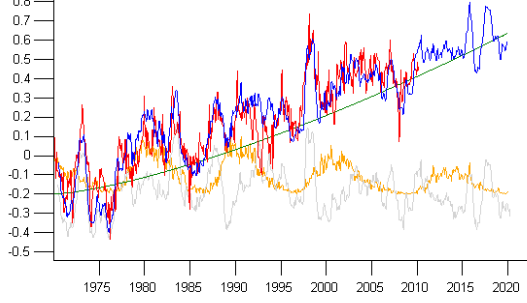 |
|
|
|
Post by sigurdur on Apr 17, 2010 14:36:15 GMT
SoCold:
What are you trying to project here? And where is the missing heat that Mr. Trenbeth is so intint is here but just can't be found?
|
|
|
|
Post by trbixler on Apr 17, 2010 15:49:23 GMT
|
|
|
|
Post by glc on Apr 17, 2010 18:31:15 GMT
Solar magnetic cycle climate change is not instantaneous. How long did it take for the planet to warm in the 20th century?
It wamed up pretty much immediately. The was a HMF minimum in around 1912-13 but warming was more or less underway by then.
Based on analysis of step forcing changes caused by large volcanic eruptions, it is estimated that the top 150 m of the ocean has a e-folding time of around 5 years (+/- 1 year). There will be a delay as the El Nino heat leaves the ocean and the ocean cools.
So how long do you think we've been in the current minimum? Remember also that the last "strong" cycle ended in 1996. Solar Cycle 23 wasn't particularly remarkable.
I notice Lockwood has published a new paper that recants his previous paper's conclusion that the sun did not cause a portion of the 20th century warming.
Has he - can you give me a link to the paper?
|
|
|
|
Post by socold on Apr 17, 2010 18:57:47 GMT
SoCold: What are you trying to project here? And where is the missing heat that Mr. Trenbeth is so intint is here but just can't be found? I suggest that the solar minimum has affected the past few years. Knocking about 0.15C off global temperature. That's been largely countered by the rise in co2 over that period. So what we get as a result is flat temperatures since 2003. |
|
|
|
Post by sigurdur on Apr 17, 2010 19:13:35 GMT
SoCold: What are you trying to project here? And where is the missing heat that Mr. Trenbeth is so intint is here but just can't be found? I suggest that the solar minimum has affected the past few years. Knocking about 0.15C off global temperature. That's been largely countered by the rise in co2 over that period. So what we get as a result is flat temperatures since 2003. Ok...I don't buy the solar min so far as I have not seen anything conclusive one way or the other. Where is all this missing heat tho? And....on the sea ice thread....I am going to go back to the MWP thread. I suggest you review that thread and we can start again. |
|
|
|
Post by icefisher on Apr 17, 2010 21:49:07 GMT
SoCold: What are you trying to project here? And where is the missing heat that Mr. Trenbeth is so intint is here but just can't be found? I suggest that the solar minimum has affected the past few years. Knocking about 0.15C off global temperature. That's been largely countered by the rise in co2 over that period. So what we get as a result is flat temperatures since 2003. Dang! Hey, GLC I sense that Socold is coming to your position. . . .finally! Now guys just one more step and we will get the dance right! ;D I see both you and Socold are now predicting temperatures have ratcheted up a notch. But we haven't had a low tri-cycle yet!! Maybe in 25 years? Guess we will have to wait and see! |
|
|
|
Post by hilbert on Apr 18, 2010 2:13:44 GMT
"That is not what climate models predict, and please explain how heat bypasses the top 700m of ocean when 85% of the heat resides there."
I'm not arguing that there's heat in the pipeline, because I don't think that there is. Does the top 700m of ocean make up 85% of the ocean water, though?
Thanks,
hilbert
|
|
|
|
Post by sigurdur on Apr 18, 2010 2:41:44 GMT
William:
Some of us have come to that conclusion long ago as the observed evidence did not match the modeled evidence. Trenbeth will have a hard time wrapping his mind around this as he has become so distant from reality, and his source of funding is in peril because of this, that he will be fighting screaming etc that it just can't be so. Which, it appears he is.
That doesn't make him or his like good or bad, just a bit blinded at this time. As Eistien has said......" I may be right 99 times, but proven wrong only takes one time"
Or something to that order. Time for the AGW folks to look a bit deeper into the science of climate as it is so very very apparant that there is much to learn.
|
|
|
|
Post by icefisher on Apr 18, 2010 3:56:26 GMT
Solar magnetic cycle climate change is not instantaneous. How long did it take for the planet to warm in the 20th century? It wamed up pretty much immediately. The was a HMF minimum in around 1912-13 but warming was more or less underway by then. How do you come up with statements like that? Fact is according to Hadcrut there was .604 cooling in the 33 years from 1878 to 1911. Thats comparable to the recent warming we have seen over the past 33 years (.694). Is up always down for you? And down up depending upon your angle? Based on analysis of step forcing changes caused by large volcanic eruptions, it is estimated that the top 150 m of the ocean has a e-folding time of around 5 years (+/- 1 year). There will be a delay as the El Nino heat leaves the ocean and the ocean cools. So how long do you think we've been in the current minimum? Remember also that the last "strong" cycle ended in 1996. Solar Cycle 23 wasn't particularly remarkable.
Solar Cycle 23 was above average anyway you want to look at it. If you create a database that includes both a grand minimum and a grand maximum, solar cycle 23 was 50% above average. Thats pretty remarkable even if it is fairly common. Solar Cycle 23 is only not remarkable in a short record that includes a grand maximum and not a grand minimum. . . .thats a remarkable potential bias. |
|
|
|
Post by Pooh on Apr 18, 2010 5:48:27 GMT
Socold posted in Re: Where's the Heat, Cooling Oceans « Reply #16 Yesterday (4/17/10) at 9:31am »
I have become reluctant to credit graphs beginning in 1850 and 1970 as indication of global warming trends, linear or exponential. Similarly, graphs beginning in 1998 as indication of cooling suffer in credibility. I can get similar trend lines by picking start and end points on a sine wave.
The dangly lines beyond 2010 assume a uniform root-cause process. In my view, this is a leap of faith.
"Prediction is very difficult, especially about the future." -- Niels Bohr
And I would really like to see a citation for that exponential.
|
|
|
|
Post by hunter on Apr 18, 2010 14:58:32 GMT
Pooh,
The most significant thing about the start dates of the graphs the AGW promoters create the believers use is that when you look at actual climate-scale periods of a few thousand years, the current period no matter the start date is unremarkable.
|
|
|
|
Post by sigurdur on Apr 18, 2010 16:23:56 GMT
Pooh, The most significant thing about the start dates of the graphs the AGW promoters create the believers use is that when you look at actual climate-scale periods of a few thousand years, the current period no matter the start date is unremarkable. Precisely the point Hunter. It is unremarkable. And now that the heat that is suppose to be here, according to models, isn't here it makes it even more unremarkable. One can only hope that the blinders will come off and people with access to information start looking for the forcings that are at work, but not accounted for. |
|
|
|
Post by magellan on Apr 18, 2010 17:46:36 GMT
"That is not what climate models predict, and please explain how heat bypasses the top 700m of ocean when 85% of the heat resides there." I'm not arguing that there's heat in the pipeline, because I don't think that there is. Does the top 700m of ocean make up 85% of the ocean water, though? Thanks, hilbert Does the top 700m of ocean make up 85% of the ocean water, though? The upper 700m contains 80-90% of the heat stored, the imbalance if you will. The pic below is derived straight from The smoking gun, citing Levitus. Trenberth has placed it as high as 90%, so I split the difference. See a problem with the new and improved flip flopped version? Hence my rant about it being BS. Bottom line: the models are wrong. If anyone has noticed, even RC is careful to attribute the current El Nino as a return to the promised AGW Big Warm because they know what's coming in the next 12 months. 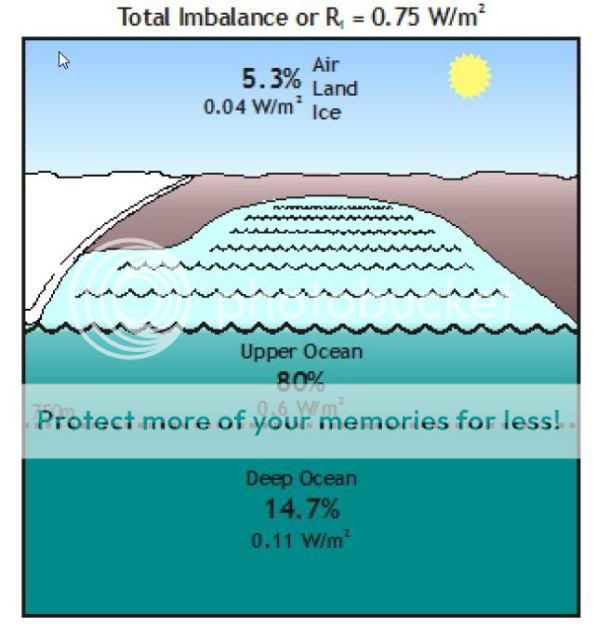 |
|


