|
|
Post by acidohm on Jan 13, 2015 22:48:35 GMT
wattsupwiththat.com/2015/01/13/al-gore-wrong-again-polar-ice-continues-to-thrive/That Woods Hole study was confirmed by today’s NOAA Arctic radar map which shows the Arctic Ice Cap at more than 4,000,000 square miles, larger than on any December 28 in the past five years. Reaching the North Pole requires either a dog sled or a nuclear sub; Al Gore’s cruise ship will stay in the tropics. At the South Pole, Antarctic ice coverage is at the highest extent since radar measurement began 35 years ago. NOAA’s Arctic Report Card; Update for 2014 provides similar data for the Earth’s other big ice sheet, Greenland. Data from the GRACE satellite and other sources has shown an annual average Greenland ice loss of more than 300 billion tons until 2013. That loss has now dropped sharply by 98% to 6 billion annual tons since mid 2013. A loss of 300 billion tons adds about one millimeter to sea level rise.
|
|
|
|
Post by sigurdur on Mar 15, 2015 14:25:43 GMT
|
|
|
|
Post by Ratty on Mar 22, 2017 0:32:52 GMT
|
|
|
|
Post by missouriboy on Mar 22, 2017 1:03:40 GMT
Apparently someone failed to tell the Global Ocean that 2016 was the warmest year evah.  |
|
|
|
Post by nautonnier on Mar 23, 2017 13:14:58 GMT
Apparently someone failed to tell the Global Ocean that 2016 was the warmest year evah. Considering that the top 2 meters of ocean contain more heat than the entire atmosphere - if the oceans are venting heat then the atmosphere may well be 'hottest evah' because it is the open door to space. Like standing outside the wide open front door saying its really warm out tonight. |
|
|
|
Post by missouriboy on Mar 24, 2017 20:02:46 GMT
Apparently someone failed to tell the Global Ocean that 2016 was the warmest year evah. Considering that the top 2 meters of ocean contain more heat than the entire atmosphere - if the oceans are venting heat then the atmosphere may well be 'hottest evah' because it is the open door to space. Like standing outside the wide open front door saying its really warm out tonight. I went back to the UAH v6.0 data base to get a visual of the differences between the lower troposphere Ocean and land temperature deviations for the 1978-2016 period. There is a recognizable lag effect between Ocean and land heating and cooling, with land lagging ocean. There is also something else. Perhaps someone could be so kind as to explain it to me. There is a marked change in the relationship between ocean and land deviations that occurs about 1997. Prior to that date, land deviation values consistently fell below ocean values during cooling periods. Afterwards, very rarely. I grasp the step increase in ocean lower troposphere temps that occurred in 1997. How is it that land values increased even higher, and stayed there? The version 6 changes had nothing to do with it. One assumes that the base period used for calculating the deviations is the same. 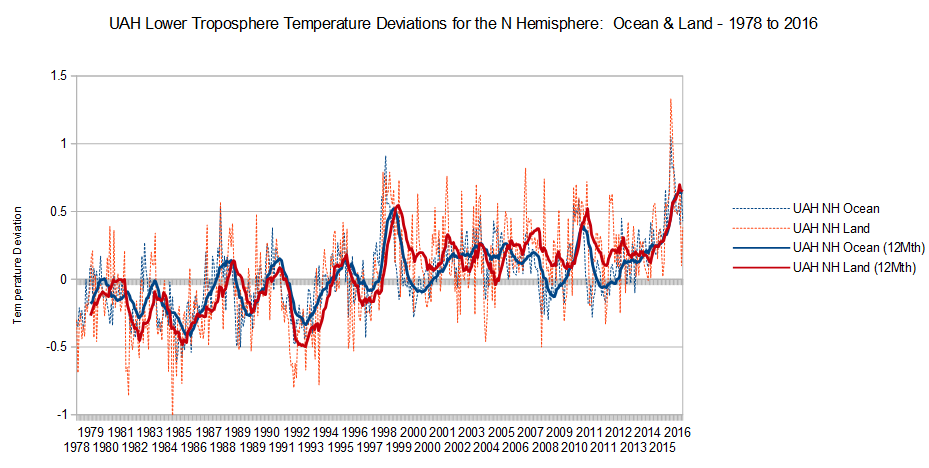 |
|
|
|
Post by duwayne on Mar 24, 2017 20:43:46 GMT
Missouriboy, my guess would be that the quasi-60 year ocean cycle is the cause. The ocean current warm cycle causes warmer ocean temperatures on the left side of the graph and the cool cycle lowers ocean temperatures relative to land temperatures on the right side of the graph.
ENSO causes large swings. If you would use 7-year smoothing to dampen the ENSO effect, the 60-year ocean cycle might be even clearer.
|
|
|
|
Post by missouriboy on Mar 24, 2017 22:05:33 GMT
It has also been suggested that enthalpy could also be culprit, in the sense that a dryer lower troposhere could increase temperature values. Such a decline in atmospheric humidity was observed in ~1997 although there is nothing that states that this would be differentially concentrated over land. The AMO cool-warm phase is pretty much coincident with the 1997 shift.  |
|
|
|
Post by sigurdur on Mar 26, 2017 18:27:21 GMT
Observed increases in ocean heat content (OHC) and temperature are robust indicators of global warming during the past several decades. We used high-resolution proxy records from sediment cores to extend these observations in the Pacific 10,000 years beyond the instrumental record. We show that water masses linked to North Pacific and Antarctic intermediate waters were warmer by 2.1 ± 0.4°C and 1.5 ± 0.4°C, respectively, during the middle Holocene Thermal Maximum than over the past century. Both water masses were ~0.9°C warmer during the Medieval Warm period than during the Little Ice Age and ~0.65° warmer than in recent decades. Although documented changes in global surface temperatures during the Holocene and Common era are relatively small, the concomitant changes in OHC are large. science.sciencemag.org/content/342/6158/617 |
|
|
|
Post by nautonnier on Mar 26, 2017 20:04:44 GMT
Observed increases in ocean heat content (OHC) and temperature are robust indicators of global warming during the past several decades. We used high-resolution proxy records from sediment cores to extend these observations in the Pacific 10,000 years beyond the instrumental record. We show that water masses linked to North Pacific and Antarctic intermediate waters were warmer by 2.1 ± 0.4°C and 1.5 ± 0.4°C, respectively, during the middle Holocene Thermal Maximum than over the past century. Both water masses were ~0.9°C warmer during the Medieval Warm period than during the Little Ice Age and ~0.65° warmer than in recent decades. Although documented changes in global surface temperatures during the Holocene and Common era are relatively small, the concomitant changes in OHC are large. science.sciencemag.org/content/342/6158/617To translate - we are observing global cooling. |
|
|
|
Post by sigurdur on Mar 26, 2017 21:22:51 GMT
Yep
|
|
|
|
Post by Ratty on Sept 8, 2017 6:43:37 GMT
I hear the heat is hiding down there, out of sight and sun.
|
|
|
|
Post by neilhamp on Sept 8, 2017 7:11:52 GMT
North Atlantic has been losing heat content since 2009 With the forthcoming Solar Minimum I am expecting at least one very cold winter in the UK from 2017 to 2022  |
|
|
|
Post by missouriboy on Sept 8, 2017 14:06:14 GMT
North Atlantic has been losing heat content since 2009 With the forthcoming Solar Minimum I am expecting at least one very cold winter in the UK from 2017 to 2022 It's good to see that you're an optimist Neil.  |
|
|
|
Post by Ratty on Sept 8, 2017 16:51:15 GMT
[ Snip ] what happened before 1979? Every chance there was some natural variability? |
|


