|
|
Post by af4ex on Mar 17, 2011 11:53:32 GMT
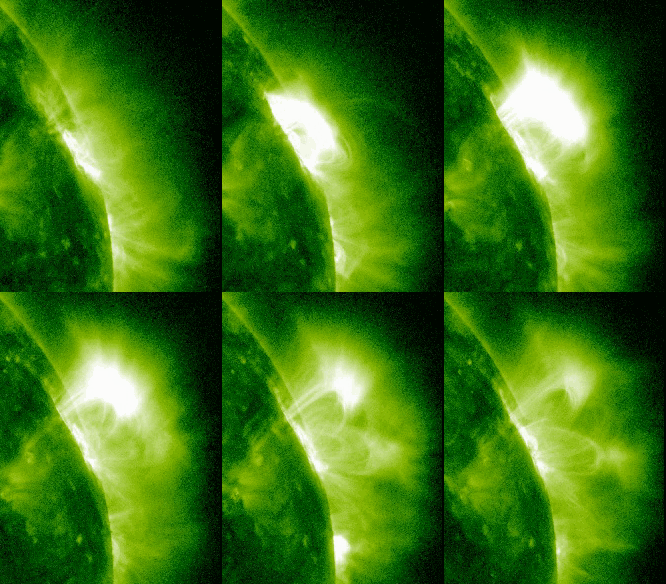
Here's one for your image gallery, Kevin, another clip of the slow flare, this time in 304 angstrom light.  |
|
|
|
Post by Kevin VE3EN on Mar 17, 2011 12:04:00 GMT
Here's one for your image gallery, Kevin, another clip of the slow flare, this time in 304 angstrom light.  Nice clip. Added  |
|
|
|
Post by af4ex on Mar 17, 2011 16:10:00 GMT
Begging your indulgence for one more clip of the slow flare, this time at 94 angstroms. This is getting close to "soft x-rays" and reveals that the "windy" region north of the loops (invisible in the other clips) seems to be where the flare actually occurred. Also, at the end of the clip, note that there is another powerful flare on the far side. This appears to be our old friend AR11166, the powerhouse, which is still going strong and entertaining the folks over on Planet X.  The 1169 flare was reported as a C3.7 event by NOAA, reported as spanning from 1752Z to 2324Z. Actually, seems like it spilled over into the wee hours of 17-Mar too, but NOAA didn't report that.  This is an enormous flare, diluted by time, so the peak intensity is only C-Class. But if the integrated area under the curve represents its total energy, then WOW!  |
|
|
|
Post by af4ex on Mar 17, 2011 16:22:36 GMT
@me > But if the integrated area under the curve represents > its total energy, then WOW!  Oops, this is a logarithmic plot, so you really can't do additive comparisons like that. But, in any case, a whopper flare! :-| |
|
|
|
Post by lsvalgaard on Mar 17, 2011 19:12:52 GMT
@me > But if the integrated area under the curve represents > its total energy, then WOW!  Oops, this is a logarithmic plot, so you really can't do additive comparisons like that. But, in any case, a whopper flare! :-| You can, you just have to integrate the actual numbers, not the logarithms. And the total energy is large. |
|
|
|
Post by af4ex on Mar 18, 2011 13:49:34 GMT
I was talking to one of my Planet X ham buddies on -146.52 MHz last nite (they use negative frequencies, that's why none of us Earth hams can hear them). He said their solar flux index was way above 100. I told him to wait a week or two. The situation will change. ;D Attachments:
|
|
|
|
Post by yo5owb on Mar 18, 2011 22:27:09 GMT
Hi, can anyone explain me something How can I know from attached picture if there is propagation on VHF I'm thinking that if Bt is high and Bz is lower than there are condition right ? Or I'm struck here now  Attachments:
|
|
|
|
Post by af4ex on Mar 18, 2011 23:55:58 GMT
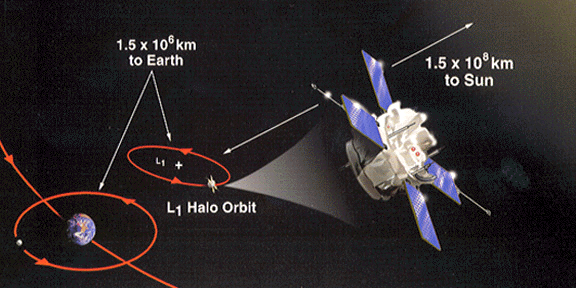
@septy > How can I know from attached picture if there is > propagation on VHF Those are the Advanced Composition Explorer (ACE) plots, which have little to do with current VHF propagation.  1) The ACE satellite is a million miles away, in an L1 "halo" orbit, between the Earth and the Sun, monitoring solar wind. 2) Solar wind travels very slowly (compared to RF) around 500 km/sec, so can take many hours to reach Earth. 3) Most of the solar wind is ducted into the polar areas by the Earth's magnetic field, so has big effect on auroras and auroral RF propagation in the far Northern (and Southern) latitudes. Not as much effect going in closer to the equator. HF propagation is influenced more by extreme ultltraviolet (EUV) and x-ray radiation from the Sun, especially flares. These ionize the layers and can enhance or inhibit reflections of RF by the ionosphere. The 304 angstrom emission is a big factor in this ionization, along with x-rays during the big flares. VHF (espeically 6m) propagation is enhanced by Sporadic E events in the E-layer, which are not well understood. Otherwise, long-range VHF propagation is mostly due to tropospheric ducting which has nothing to do, directly, with the Sun. More related to local weather conditions etc. www.dxinfocentre.com/tropo_eur.htmlMore on propagation forecasting here: www.dxzone.com/catalog/Software/Propagation/Hope that helps! John/af4ex |
|
|
|
Post by THEO BAKALEXIS on Mar 19, 2011 20:31:06 GMT
|
|
|
|
Post by THEO BAKALEXIS on Mar 20, 2011 12:06:50 GMT
Heavy clouds and today and i can`t see the sun with my scopes. Low activity the last days but................. Coming the areas who gave the regions 11165, 11164. You remember this regions. They gave a serious period of flares M-class before two weeks. Now we see a great tunnel of magnetic loops over 11175 and cold plasma over region 11174 at the limb. www.solar-007.eu/site/ |
|
|
|
Post by af4ex on Mar 21, 2011 11:24:14 GMT
There was a small C-class flare around 0950Z. NOAA hasn't reported it yet. My guess it was from AR11175. Old friends 1163-1165 starting to re-appear. Judging from the "preglow" on the east limb, old 1165 looks very active in microwave and x-ray. Attachments:
|
|
|
|
Post by sunspotboy on Mar 21, 2011 15:10:05 GMT
Does anybody know the polarity of the CME that hit the earth on March 10 -11?
Southern polarity?
Northern?
Mix of the 2?
I expect it to be very important in relation to the earthquake in Japan...
|
|
|
|
Post by af4ex on Mar 21, 2011 15:15:11 GMT
Big sunspot (old 1165) rotating into view! ;D Attachments:
|
|
|
|
Post by af4ex on Mar 21, 2011 15:31:48 GMT
Does anybody know the polarity of the CME that hit the earth on March 10 -11? Southern polarity? Northern? Mix of the 2? I expect it to be very important in relation to the earthquake in Japan... You should be able to figure it out from this summary: hirweb.nict.go.jp/sedoss/solact3Will it only be "important" if it matches your expectations? (i.e. beware of confirmation bias). en.wikipedia.org/wiki/Confirmation_bias:-| |
|
|
|
Post by w7psk on Mar 21, 2011 16:13:11 GMT
Big sunspot (old 1165) rotating into view! ;D Does look Huge, Back ground noise has risen to C level. Could be a fun one to watch. |
|