|
|
Post by sigurdur on Feb 27, 2015 23:18:06 GMT
Yep.......that one.
Thanks Ratty.
|
|
|
|
Post by nautonnier on Feb 28, 2015 15:23:17 GMT
Here is an interesting set of graphics and animations of the North Atlantic DriftAnd of course you can look at current reports using Earth Null SchoolIt does seem from the graphics that the northern extent of the North Atlantic Drift is not reaching past about 50N the southern latitudes of UK. { Hypothesize} I wonder if the Length of Day variations caused by the changes in the position of the barycenter of the Solar system have an effect 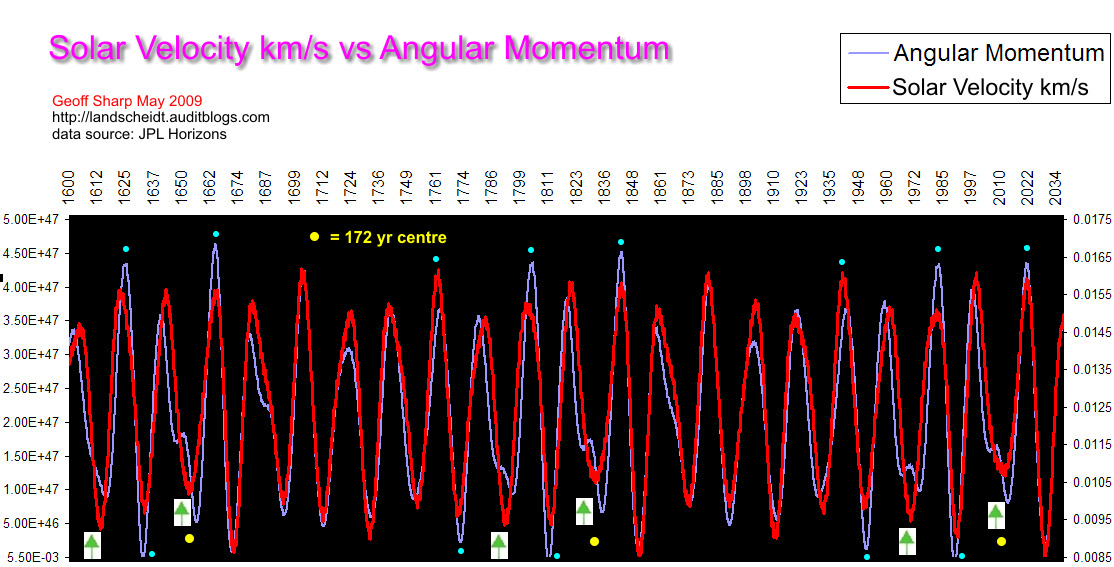 That is the solar angular momentum changes (which I believe interest Theo) This was discussed at WUWT in 2011 Solar, Terrestrial, & Lunisolar Components of Rate of Change of Length of Day If the Barycenter moving affects the motion of the Sun as it is orbiting around the barycenter which can be more than a solar diameter outside the Sun. The Sun will have changes in its internal activity impacted by the relative position and motion of the Barycenter compared to the rotation of the Sun and its movement through space. Then the Earth will also have its velocity changed which will have an affect on Earth's angular momentum and LOD. If that also alters the flow of the thermohaline current then dependent on the time the LOD changes occur you could have different impacts on the current flow. This would be independent of any heating/cooling effects by changes in activity of the Sun, also caused by Solar angular momentum and Barycenter position but could amplify or moderate them. { /Hypothesize} Word of the day is EPITROCHOID  |
|
|
|
Post by missouriboy on Feb 28, 2015 20:47:24 GMT
Can someone post the picture in the above link? OOPS ... Guess I was late. 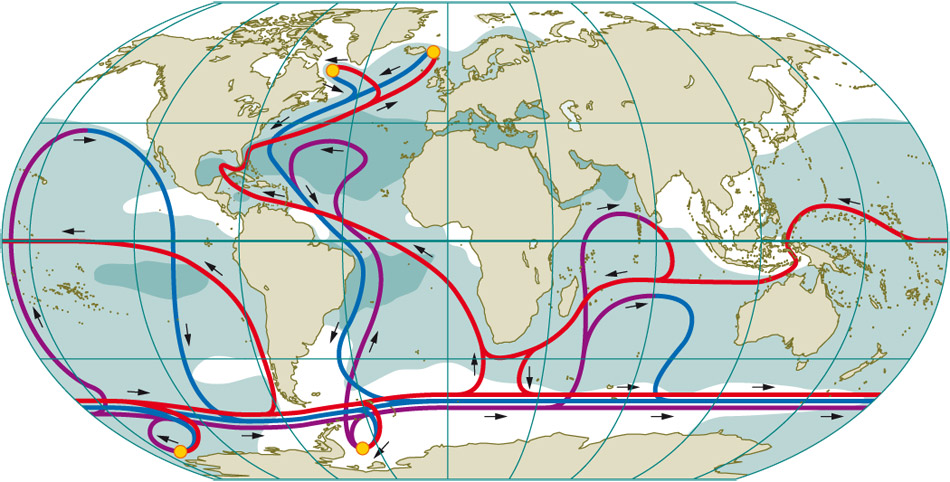 |
|
|
|
Post by missouriboy on Feb 28, 2015 21:18:56 GMT
And I'm assuming that nobody failed to note that the two previous comparable periods (yellow dots) are the Maunder and Dalton Minimums?  ?? |
|
|
|
Post by Ratty on Feb 28, 2015 22:46:07 GMT
[ Snip ] Word of the day is EPITROCHOID Learn a new thing every day. Thinks: Now, how can I use that word in casual conversation?  |
|
|
|
Post by missouriboy on Feb 28, 2015 23:54:28 GMT
[ Snip ] Word of the day is EPITROCHOID Learn a new thing every day. Thinks: Now, how can I use that word in casual conversation? Epitrochoid From Wikipedia, the free encyclopedia An epitrochoid (/?p??tr?k??d/ or /?p??tro?k??d/) is a roulette traced by a point attached to a circle of radius r rolling around the outside of a fixed circle of radius R, where the point is a distance d from the center of the exterior circle. CASUAL CONVERSATION Lay off the Barleycorn or you'll start to look like an Epitrochoid! Then I'm gonna whack your barycenter! ... THAT should straighten em right up. |
|
|
|
Post by flearider on Mar 1, 2015 9:17:15 GMT
simple that big blob of cold in the middle off the uk .. which has come from (said it before) the Antarctic same as the blob under japan .. they have grown bigger for the last 3-4 yrs Maybe you've mentioned this before and i just missed it ... but out of curiousity ... what might be the mechanism by which deep Antarctic water recirculates to the North Atlantic? I've seen peoples' versions of bottom currents heading from the Antarctic to Japan, but never to the N. Atlantic. Of course, we know so little about these things ... that's an assumption on my part! momentum of flowing fluids.. larger the ice the more of a melt the greater force pushing it further into the NH follow the currants marinebio.org/i/currents/oceancurrents.jpg the force on a fluid flow in a set direction is equal to its mass |
|
dh7fb
New Member

Posts: 25
|
Post by dh7fb on Mar 2, 2015 9:43:41 GMT
|
|
|
|
Post by nautonnier on Mar 2, 2015 12:02:50 GMT
That certainly is an interesting paper particularly this graphic from Argo of the sub-polar gyre just South of Greenland 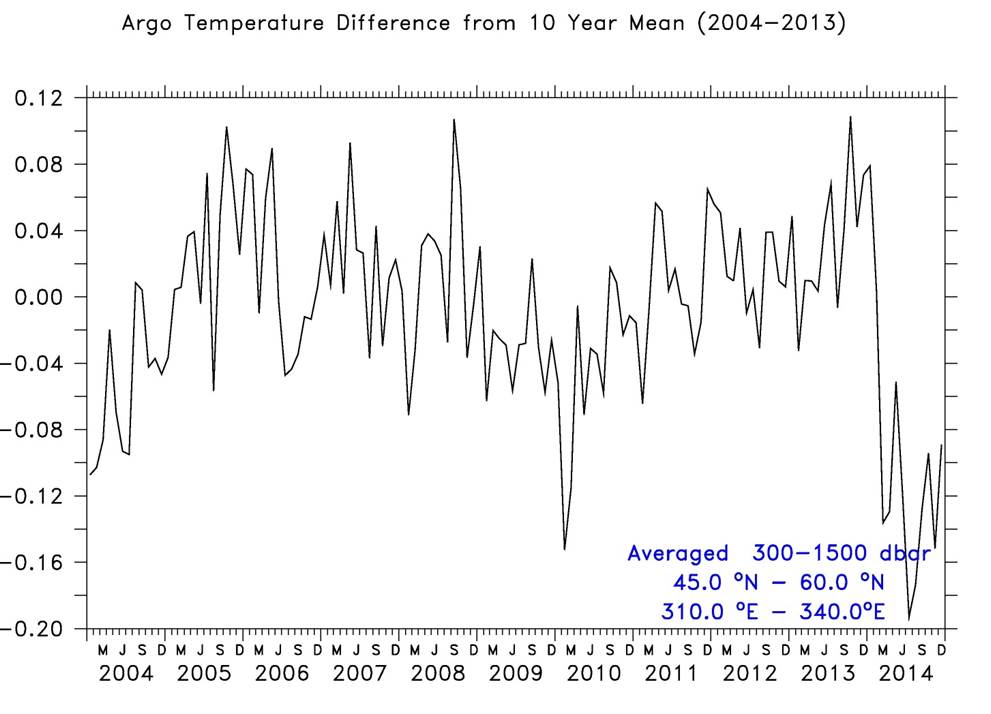 Something has happened at the top end of the North Atlantic Drift. Maybe the open water that has all the warmers jumping about with glee, has resulted in a huge heat loss. |
|
|
|
Post by sigurdur on Mar 23, 2015 20:42:02 GMT
www.vox.com/2015/3/23/8277345/atlantic-overturning-circulationIn the 2004 disaster film The Day After Tomorrow, global warming causes a major disruption to ocean currents in the North Atlantic, which in turn brings about a sudden ice age in New York City. That scenario was mostly ridiculous and overhyped. Still, the underlying idea that global warming could disrupt some important ocean circulation systems isn't far-fetched. This sort of event wouldn't blanket Manhattan in ice, but it could wreak havoc on fisheries or speed up sea-level rise in places like Boston and New York.
|
|
|
|
Post by sigurdur on Mar 23, 2015 20:50:19 GMT
|
|
|
|
Post by missouriboy on Mar 23, 2015 22:40:36 GMT
This is an interesting paper. However, what does it do to their analysis if the temperature data they are using is outrageously inflated? That 'remarkably' cold bubble may not be so 'remarkably' cold if the world temperature data has been inflated by 1 or 2 degrees. Just like a normal person may really look strange when surrounded by psychopaths. |
|
|
|
Post by sigurdur on Mar 24, 2015 0:26:30 GMT
|
|
|
|
Post by missouriboy on Mar 24, 2015 4:07:48 GMT
Based on what I've read, if have no doubt that the AMO is falling and that the AMOC is slowing down ... net result, less warm water in the North Atlantic. The following represent how i understand the process. Correct me where I'm wrong. 1. The AMO is a measure of SST in the North Atlantic. The index actually being a deviation from normal SST. 2. These temps are largely the result of the AMOC moving tropical waters northward (forgetting the return flows for the moment). The AGW folks, while acknowledging solar heating, believe that CO2 has forced these values higher. The Solar folks believe that naturally occurring solar output cycles (in all their forms) are the primary driver of these differentials. 3. Cold to warm AMO cycles occur in the record over approx. 60 years. We only have two of these in the AMO time series and the actual instrumentation record is rather short. The actual time frame is roughly ... 1 cold (1880-1926), 1 warm (1926-1960), 1 cold (1960-1990), 1 warm (1990-2014). The have actually shortened in duration. 4. The author calculates the AMOC flow / strength as the difference of the difference index values (subpolar N. Atlantic minus northern Hemisphere temp index). If current NH temps have been inflated for recent years and deflated for past years, then, of course, the AMOC flow falls like a rock. Notice that the 1960s hardly seem to register on the graph. Interestingly, the 1880s seem to appear. And if we don't believe the NH temps of the last 100 years, is there ANY reason to believe something that goes out 1000 years put together by the same people? And LOWER THAN THE MAUNDER MINIMUM? ?? On what basis O scientare? 5. There MAY be something unique in this downturn, but HOW do we know that it is SIGNIFICANTLY different than what happened in the 60s or the 1880s? Is this partly what happens when the people and agency doing the reporting have lost their credibility? |
|
|
|
Post by sigurdur on Mar 24, 2015 4:40:14 GMT
You got it Missouriboy.
|
|


 ??
??

