|
|
Post by nautonnier on Jun 20, 2016 9:41:58 GMT
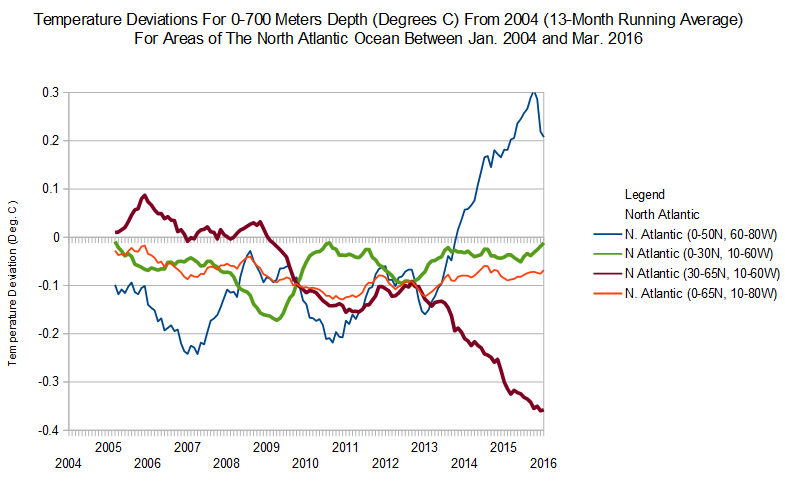
From that article  That is a graph of heat content for the top 700 meters of the North Atlantic area within 60-0W and 30-65N. That is a huge amount of heat loss (and prior gain) millions of kilojoules probably enough to raise atmospheric temperatures by a few degrees. Where did all that heat go? Did it all just radiate to space? |
|
|
|
Post by acidohm on Jun 20, 2016 14:36:15 GMT
From that article  That is a graph of heat content for the top 700 meters of the North Atlantic area within 60-0W and 30-65N. That is a huge amount of heat loss (and prior gain) millions of kilojoules probably enough to raise atmospheric temperatures by a few degrees. Where did all that heat go? Did it all just radiate to space? Bob Tisdale took this graph to peices....on wuwt in think? Ill try and dig it out.... |
|
|
|
Post by missouriboy on Jun 20, 2016 15:01:23 GMT
From that article  That is a graph of heat content for the top 700 meters of the North Atlantic area within 60-0W and 30-65N. That is a huge amount of heat loss (and prior gain) millions of kilojoules probably enough to raise atmospheric temperatures by a few degrees. Where did all that heat go? Did it all just radiate to space? Yes ... but in the Argo temperature-accounting world most of the 30-65N-10-60W decline is redistributed to the North Atlantic west of 60 W ... although note, that in the last few months, this temperature deviation has declined by 0.1 C. Will it continue? Overall, the entire N. Atlantic (that part Argo measures / publishes) is down by about 0.1 C since 2004. The merry-go-round appears to be stuck!  |
|
|
|
Post by acidohm on Jun 20, 2016 15:57:25 GMT
Bob Tisdale took this view on this source yesterday on a WUWT comment
David Archibald, Professor Humlum’s graph is not representative of the North Atlantic as a whole. The coordinates of 30-65N, 60W-0 represent only a portion of the extratropical North Atlantic. Some might say Professor Humlum cherry-picked the coordinates, considering the increase of subsurface temperatures west of 60W from 2007 to 2015. See the following trend map for that period.
For the depths of 0-700 meters and for the coordinates typically used for the North Atlantic (0-70N, 80W-0, used by NOAA for their AMO data), there has been a slight decline in the NODC-based subsurface temperatures since 2004, roughly -0.05 -0.1 deg C based on a linear trend (not shown).
Also, for the ARGO era, starting in 2005, the NODC-based data to 2000 meters for the North Atlantic (0-70N, 80W-0) show a slight increase (not decrease) in subsurface temperatures.
Cheers.
wattsupwiththat.com/2016/05/02/the-canary-in-the-water-column-atlantic-ocean-heat-content-plummets/comment-page-1/#comment-2205196
Old post.....
|
|
|
|
Post by acidohm on Jun 20, 2016 18:18:51 GMT
From that article  That is a graph of heat content for the top 700 meters of the North Atlantic area within 60-0W and 30-65N. That is a huge amount of heat loss (and prior gain) millions of kilojoules probably enough to raise atmospheric temperatures by a few degrees. Where did all that heat go? Did it all just radiate to space? Yes ... but in the Argo temperature-accounting world most of the 30-65N-10-60W decline is redistributed to the North Atlantic west of 60 W ... although note, that in the last few months, this temperature deviation has declined by 0.1 C. Will it continue? Overall, the entire N. Atlantic (that part Argo measures / publishes) is down by about 0.1 C since 2004. The merry-go-round appears to be stuck!  So....as I sit down for a minute (finally!!!) and look at the co-ordinates above, blue essentially covers the Gulf stream (ish) purple covers where the blue blob mostly resides, green and orange are much broader and give a better 'general' impression?? this interestingly shows what we've been seeing, ie cold blob.....but also shows a cooling of the gulf stream portion?? but quite recently.... Quick question, if anomalies compare existing temps to historic ones, how big an effect on the anomaly is a continuous cooling?? part answer to my own question, nullschools anomaly defined as this...... ocean surface temperatures and anomaly from daily average (1981-2011) updated daily |
|
|
|
Post by nonentropic on Jun 20, 2016 20:08:22 GMT
It is in effect a moving average with a large base.
|
|
|
|
Post by acidohm on Jun 20, 2016 20:16:59 GMT
Yeah, but if temps are cooling and the base time moves in relation to the present, this will make cooling temps less anomalous, but rising temps more so??
|
|
|
|
Post by missouriboy on Jun 20, 2016 20:42:27 GMT
Yeah, but if temps are cooling and the base time moves in relation to the present, this will make cooling temps less anomalous, but rising temps more so?? Yes ... if you want to make warming look its worst, then choose the coldest base period ... or vice versa. However, one should generally not change base periods within an analysis. The purpose of the base is for creating & viewing differences ... usually because they are too small to stand out if you look at the whole value. I can see no purpose in letting your base wander! After all, you're not really interested in the base. With Argo, the time period is very short ... so the change is the deviation from that month in the first year (2004). If that happens to be the high point, then everything will look downhill from there. |
|
|
|
Post by nonentropic on Jun 21, 2016 3:41:07 GMT
we need maps of the anomaly of the anomalies.
|
|
|
|
Post by missouriboy on Jun 21, 2016 4:29:58 GMT
we need maps of the anomaly of the anomalies. Actually that's a good idea ... but your head may explode interpreting them. If climate for an area is the mean over 30 years, then the distribution of the anomalies around that mean are also part of that climate. If mean temperature of an area stays the same, but the distribution of the anomalies changes, has the climate changed? Two climates may have an average temperature of 20 C, but if one ranges from 0 C to 40 C and the other ranges from 10 C to 30 C, are they the same. No! I think we just looked at a variation of that for the North Atlantic Ocean. The mean temperature (0-700 m) for the entire ocean changed very little over 11 years. But two significant areas of that ocean changed dramatically ... one up and one down. The range in the anomaly of the anomalies increased a lot. And of course, that is referenced to a fixed base point. A psychopath and a saint may look the same on a NORMAL day.  But watch those outliers. |
|
|
|
Post by Ratty on Jun 21, 2016 5:37:00 GMT
All cherry picking should be banned.  |
|
|
|
Post by missouriboy on Jun 21, 2016 6:09:47 GMT
All cherry picking should be banned.  A general banning is certainly overdue ... last seen picking cheeries with general failure.  |
|
|
|
Post by nautonnier on Jun 21, 2016 11:53:14 GMT
All cherry picking should be banned.  A general banning is certainly overdue ... last seen picking cheeries with general failure.  It should be remembered what 'cherry pie' means in Cockney rhyming slang |
|
|
|
Post by sigurdur on Jun 30, 2016 17:50:48 GMT
Good find Code. The new paper confirms measurements. Of course, MM and SR are born and bread (Yes pun intended) to AGW. Even in the face of glaring measurements that contradict their (Hot Spot Theory).
|
|
|
|
Post by missouriboy on Jul 1, 2016 2:22:05 GMT
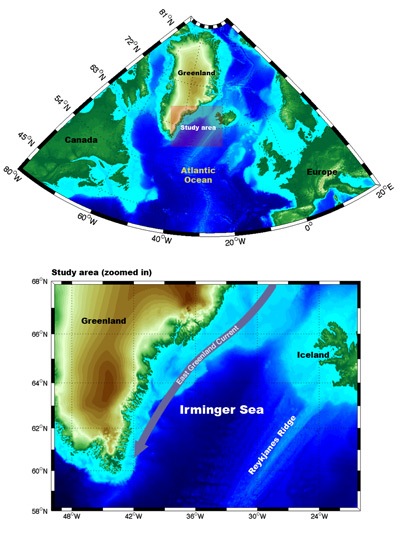
Very interesting article and I love the name ... LOCO. But ... if the convection is still strong, then what is the explanation for the slowdown in heat going north??? Settled science is always so interesting. Irminger Sea www.whoi.edu/page.do?pid=27957Freshwater superhighway The Irminger Sea, situated between southern Greenland and the Reykjanes Ridge (an underwater mountain range that extends from Iceland), is a critically important area of the North Atlantic. Currents that begin in the Arctic pass through the sea and meet North Atlantic water, forming new kinds of dense water that sinks and flows to the equator. South of Denmark Strait, along the shelfbreak, a sharp front forms where the cold, fresh outflowing Arctic-origin water meets the warm, salty recirculating subtropical-origin water. This front and its associated "jet" (a strong, narrow current)—the East Greenland/Irminger Current—is the "super highway" by which freshwater, as well as intermediate-density Arctic-origin water, is exported to the North Atlantic. The front and jet are highly unstable--as the front "wiggles" back and forth, water is exchanged across the front boundary. This is likely caused in part by the strong winds adjacent to the tall Greenland plateau. As part of the exchange process, dense shelf water appears to cascade over the shelfbreak to form a "Spill Jet" that resides below the East Greenland/Irminger Current.  |
|