|
|
Post by missouriboy on Jan 13, 2021 1:26:03 GMT
I joke about Geomagnetic Disorder Syndrome, but it may do a number on whales (part of the video).
|
|
|
|
Post by nautonnier on Jan 18, 2021 18:40:30 GMT
"Solar Cycle 25 update: Sun takes a post-minimum nap.
Back in November it looked like solar cycle 25 was finally getting underway, with daily sunspot numbers peaking up to 80, and the 30 day Wolf number climbing over 30 in early December. Since then though, the Sun has relapsed into a low activity state.
This won’t come as any surprise to Talkshop followers, we’ve been saying that cycle 25 would be very low for most of the last decade. Our group research culminated in late 2013 with publication of Rick Salvador’s orbital resonance model in the journal ‘Pattern Recognition in Physics’. We provided an update on the validation of the model a while back, showing it has remained on track since publication." More here:> tallbloke.wordpress.com/2021/01/18/solar-cycle-25-update-sun-takes-a-post-minimum-nap/
|
|
|
|
Post by missouriboy on Jan 18, 2021 20:09:08 GMT
|
|
|
|
Post by nautonnier on Jan 18, 2021 22:14:43 GMT
Didn't NASA (or their groups) make multiple predictions so they could crown the one who gets it right?? |
|
|
|
Post by missouriboy on Jan 18, 2021 23:57:45 GMT
Didn't NASA (or their groups) make multiple predictions so they could crown the one who gets it right?? Probably. Every circus needs a star.  |
|
|
|
Post by nautonnier on Jan 22, 2021 17:42:07 GMT
It is not 11 year solar cycles it is not even the 22 year Hale Cycles - no it is a 44 year double Hale cycle... "Climate Change Governed By The Sun
By guest author Kyoji Kimoto, kyoji@mirane.co.jp
January 22, 2021
I’ve compiled a list of six examples how the sun impacts climate across the globe.
1. Climate periods based on a double Hale (44-45 years) cycle of solar activity.
In 1977 Australian geologist Rhodes W. Fairbridge found a 45-year periodicity of beach ridge located at the Hudson Bay. It has been formed with storms in Hudson Bay caused by a wavier jet stream.
I have found a 44-year periodicity of heavy snowfall in Japan caused by the wavier jet stream as follows. The time series coincide quite well with that of Fairbridge (1977).
1833 Tempo famine, Dalton minimum (1795-1830)
1877 Seinan war (44 years later)
1918 Rice riot, Gleissberg minimum (1898-1923) (41 years later)
1963 38 heavy snowfall (45 years later)
2006 Heisei 18 year heavy snowfall, Gleissberg or Dalton minimum (43 years)
The climate history of 20th century can be divided with the following 5 periods based on the double Hale cycle above using aa-index of geomagnetism associated with solar activity. The Pacific Climate Shift occurred at 1977 with solar activity increase & a positive PDO index."More here: notrickszone.com/2021/01/22/japanese-climate-scientist-kyoji-kimoto-climate-change-governed-by-the-sun-co2-lesser-role/ |
|
|
|
Post by missouriboy on Jan 22, 2021 19:21:42 GMT
It is not 11 year solar cycles it is not even the 22 year Hale Cycles - no it is a 44 year double Hale cycle... "Climate Change Governed By The Sun
By guest author Kyoji Kimoto, kyoji@mirane.co.jp
January 22, 2021
I’ve compiled a list of six examples how the sun impacts climate across the globe.
1. Climate periods based on a double Hale (44-45 years) cycle of solar activity.
In 1977 Australian geologist Rhodes W. Fairbridge found a 45-year periodicity of beach ridge located at the Hudson Bay. It has been formed with storms in Hudson Bay caused by a wavier jet stream.
I have found a 44-year periodicity of heavy snowfall in Japan caused by the wavier jet stream as follows. The time series coincide quite well with that of Fairbridge (1977).
1833 Tempo famine, Dalton minimum (1795-1830)
1877 Seinan war (44 years later)
1918 Rice riot, Gleissberg minimum (1898-1923) (41 years later)
1963 38 heavy snowfall (45 years later)
2006 Heisei 18 year heavy snowfall, Gleissberg or Dalton minimum (43 years)
The climate history of 20th century can be divided with the following 5 periods based on the double Hale cycle above using aa-index of geomagnetism associated with solar activity. The Pacific Climate Shift occurred at 1977 with solar activity increase & a positive PDO index."More here: notrickszone.com/2021/01/22/japanese-climate-scientist-kyoji-kimoto-climate-change-governed-by-the-sun-co2-lesser-role/And here we are ... 44 years past the Great Climate Shift. Hmmm! Just finished reading. A little short on specifics on the 4 Hale Cycle Cycle. Interesting, but needs to be fleshed out ... something on what changes every four cycles that drives it. If you step back in 44 year increments you get 1. the great climate shift (1977) 2. the Dust Bowl period (1933) 3. the last big winter of the late 1800s (1890) 4. famine in the Scottish highlands (1846) 5. the second solar minimum of the Dalton minimum (1802). Not sure this is enough to call a long-term repetitive cycle. Needs works and mecanisms. If we get another inter-hemisphere oceanic flow (if that is part of what happened in 1976-77), then it's more interesting. Yes, 1976 to present is interesting, particularly if one could tie the shift to inter-hemisphere oceanic water mass movements. |
|
|
|
Post by nautonnier on Jan 22, 2021 20:08:50 GMT
It is not 11 year solar cycles it is not even the 22 year Hale Cycles - no it is a 44 year double Hale cycle... "Climate Change Governed By The Sun
By guest author Kyoji Kimoto, kyoji@mirane.co.jp
January 22, 2021
I’ve compiled a list of six examples how the sun impacts climate across the globe.
1. Climate periods based on a double Hale (44-45 years) cycle of solar activity.
In 1977 Australian geologist Rhodes W. Fairbridge found a 45-year periodicity of beach ridge located at the Hudson Bay. It has been formed with storms in Hudson Bay caused by a wavier jet stream.
I have found a 44-year periodicity of heavy snowfall in Japan caused by the wavier jet stream as follows. The time series coincide quite well with that of Fairbridge (1977).
1833 Tempo famine, Dalton minimum (1795-1830)
1877 Seinan war (44 years later)
1918 Rice riot, Gleissberg minimum (1898-1923) (41 years later)
1963 38 heavy snowfall (45 years later)
2006 Heisei 18 year heavy snowfall, Gleissberg or Dalton minimum (43 years)
The climate history of 20th century can be divided with the following 5 periods based on the double Hale cycle above using aa-index of geomagnetism associated with solar activity. The Pacific Climate Shift occurred at 1977 with solar activity increase & a positive PDO index."More here: notrickszone.com/2021/01/22/japanese-climate-scientist-kyoji-kimoto-climate-change-governed-by-the-sun-co2-lesser-role/And here we are ... 44 years past the Great Climate Shift. Hmmm! I wonder if Astromet has identified a reason for a 44 year cycle? |
|
|
|
Post by missouriboy on Jan 23, 2021 0:03:46 GMT
|
|
|
|
Post by missouriboy on Feb 23, 2021 19:28:11 GMT
This a nice graph of TSI and temperatures from the Maunder till approximately 2013. Needs to be brought current. Adding UV would be informative for the last couple of decades if I could find it. From Ice Age Now.  |
|
|
|
Post by duwayne on Feb 24, 2021 3:34:28 GMT
Leif Svalgaard has published a lot of articles in the past few years making the case that the sun’s “Modern Grand Maximum” didn’t happen. Chart 21 from this presentation shows his version of sunspot history. www.leif.org/research/How-to-Predict-Solar-Cycle-25.pptSvalgaard’s position has been that the solar insolation effect on earth’s temperatures has been about 0.1C from it’s lowest point to it’s highest point. This, of course, doesn’t prove that something unusual didn’t happen during the Maunder Minimum since there is not enough information to prove it one way or another. Also, Svalgaard is focused on Solar Insolation and it’s possible something else emanating from the sun affects earth’s temperature because of it’s effect on cloud cover or whatever. |
|
|
|
Post by missouriboy on Feb 24, 2021 5:37:59 GMT
Leif Svalgaard has published a lot of articles in the past few years making the case that the sun’s “Modern Grand Maximum” didn’t happen. Chart 21 from this presentation shows his version of sunspot history. www.leif.org/research/How-to-Predict-Solar-Cycle-25.pptSvalgaard’s position has been that the solar insolation effect on earth’s temperatures has been about 0.1C from it’s lowest point to it’s highest point. This, of course, doesn’t prove that something unusual didn’t happen during the Maunder Minimum since there is not enough information to prove it one way or another. Also, Svalgaard is focused on Solar Insolation and it’s possible something else emanating from the sun affects earth’s temperature because of it’s effect on cloud cover or whatever. Don't know why, but the powerpoint presentation kept crashing on me after a few slides, so I didn't get to view the whole thing. Svalgaard could be right about TSI, but may be overlooking some points. I still think that the following video from Ben Davidson (Suspicious Observors) is the best comprehensive overview / documentation of what these other factors may be, and how each may effect Earth climate. |
|
|
|
Post by nautonnier on Feb 24, 2021 14:45:35 GMT
That is the first time I have seen an explanation for 'sprites' that works. It also helps explain the formation of storms and the 'instability' of the atmosphere where they form.
Interesting.
|
|
|
|
Post by duwayne on Feb 24, 2021 18:52:42 GMT
Leif Svalgaard has published a lot of articles in the past few years making the case that the sun’s “Modern Grand Maximum” didn’t happen. Chart 21 from this presentation shows his version of sunspot history. www.leif.org/research/How-to-Predict-Solar-Cycle-25.pptSvalgaard’s position has been that the solar insolation effect on earth’s temperatures has been about 0.1C from it’s lowest point to it’s highest point. This, of course, doesn’t prove that something unusual didn’t happen during the Maunder Minimum since there is not enough information to prove it one way or another. Also, Svalgaard is focused on Solar Insolation and it’s possible something else emanating from the sun affects earth’s temperature because of it’s effect on cloud cover or whatever. Don't know why, but the powerpoint presentation kept crashing on me after a few slides, so I didn't get to view the whole thing. Svalgaard could be right about TSI, but may be overlooking some points. I still think that the following video from Ben Davidson (Suspicious Observors) is the best comprehensive overview / documentation of what these other factors may be, and how each may effect Earth climate. This link may work better for accessing Svalgaard's paper. Click on item 3051 (PFD). Goto to Chart 21. www.leif.org/research/ |
|
|
|
Post by nautonnier on Mar 2, 2021 11:39:37 GMT
"A space hurricane over the Earth’s polar ionosphere
Abstract
In Earth’s low atmosphere, hurricanes are destructive due to their great size, strong spiral winds with shears, and intense rain/precipitation. However, disturbances resembling hurricanes have not been detected in Earth’s upper atmosphere. Here, we report a long-lasting space hurricane in the polar ionosphere and magnetosphere during low solar and otherwise low geomagnetic activity. This hurricane shows strong circular horizontal plasma flow with shears, a nearly zero-flow center, and a coincident cyclone-shaped aurora caused by strong electron precipitation associated with intense upward magnetic field-aligned currents. Near the center, precipitating electrons were substantially accelerated to ~10 keV. The hurricane imparted large energy and momentum deposition into the ionosphere despite otherwise extremely quiet conditions. The observations and simulations reveal that the space hurricane is generated by steady high-latitude lobe magnetic reconnection and current continuity during a several hour period of northward interplanetary magnetic field and very low solar wind density and speed."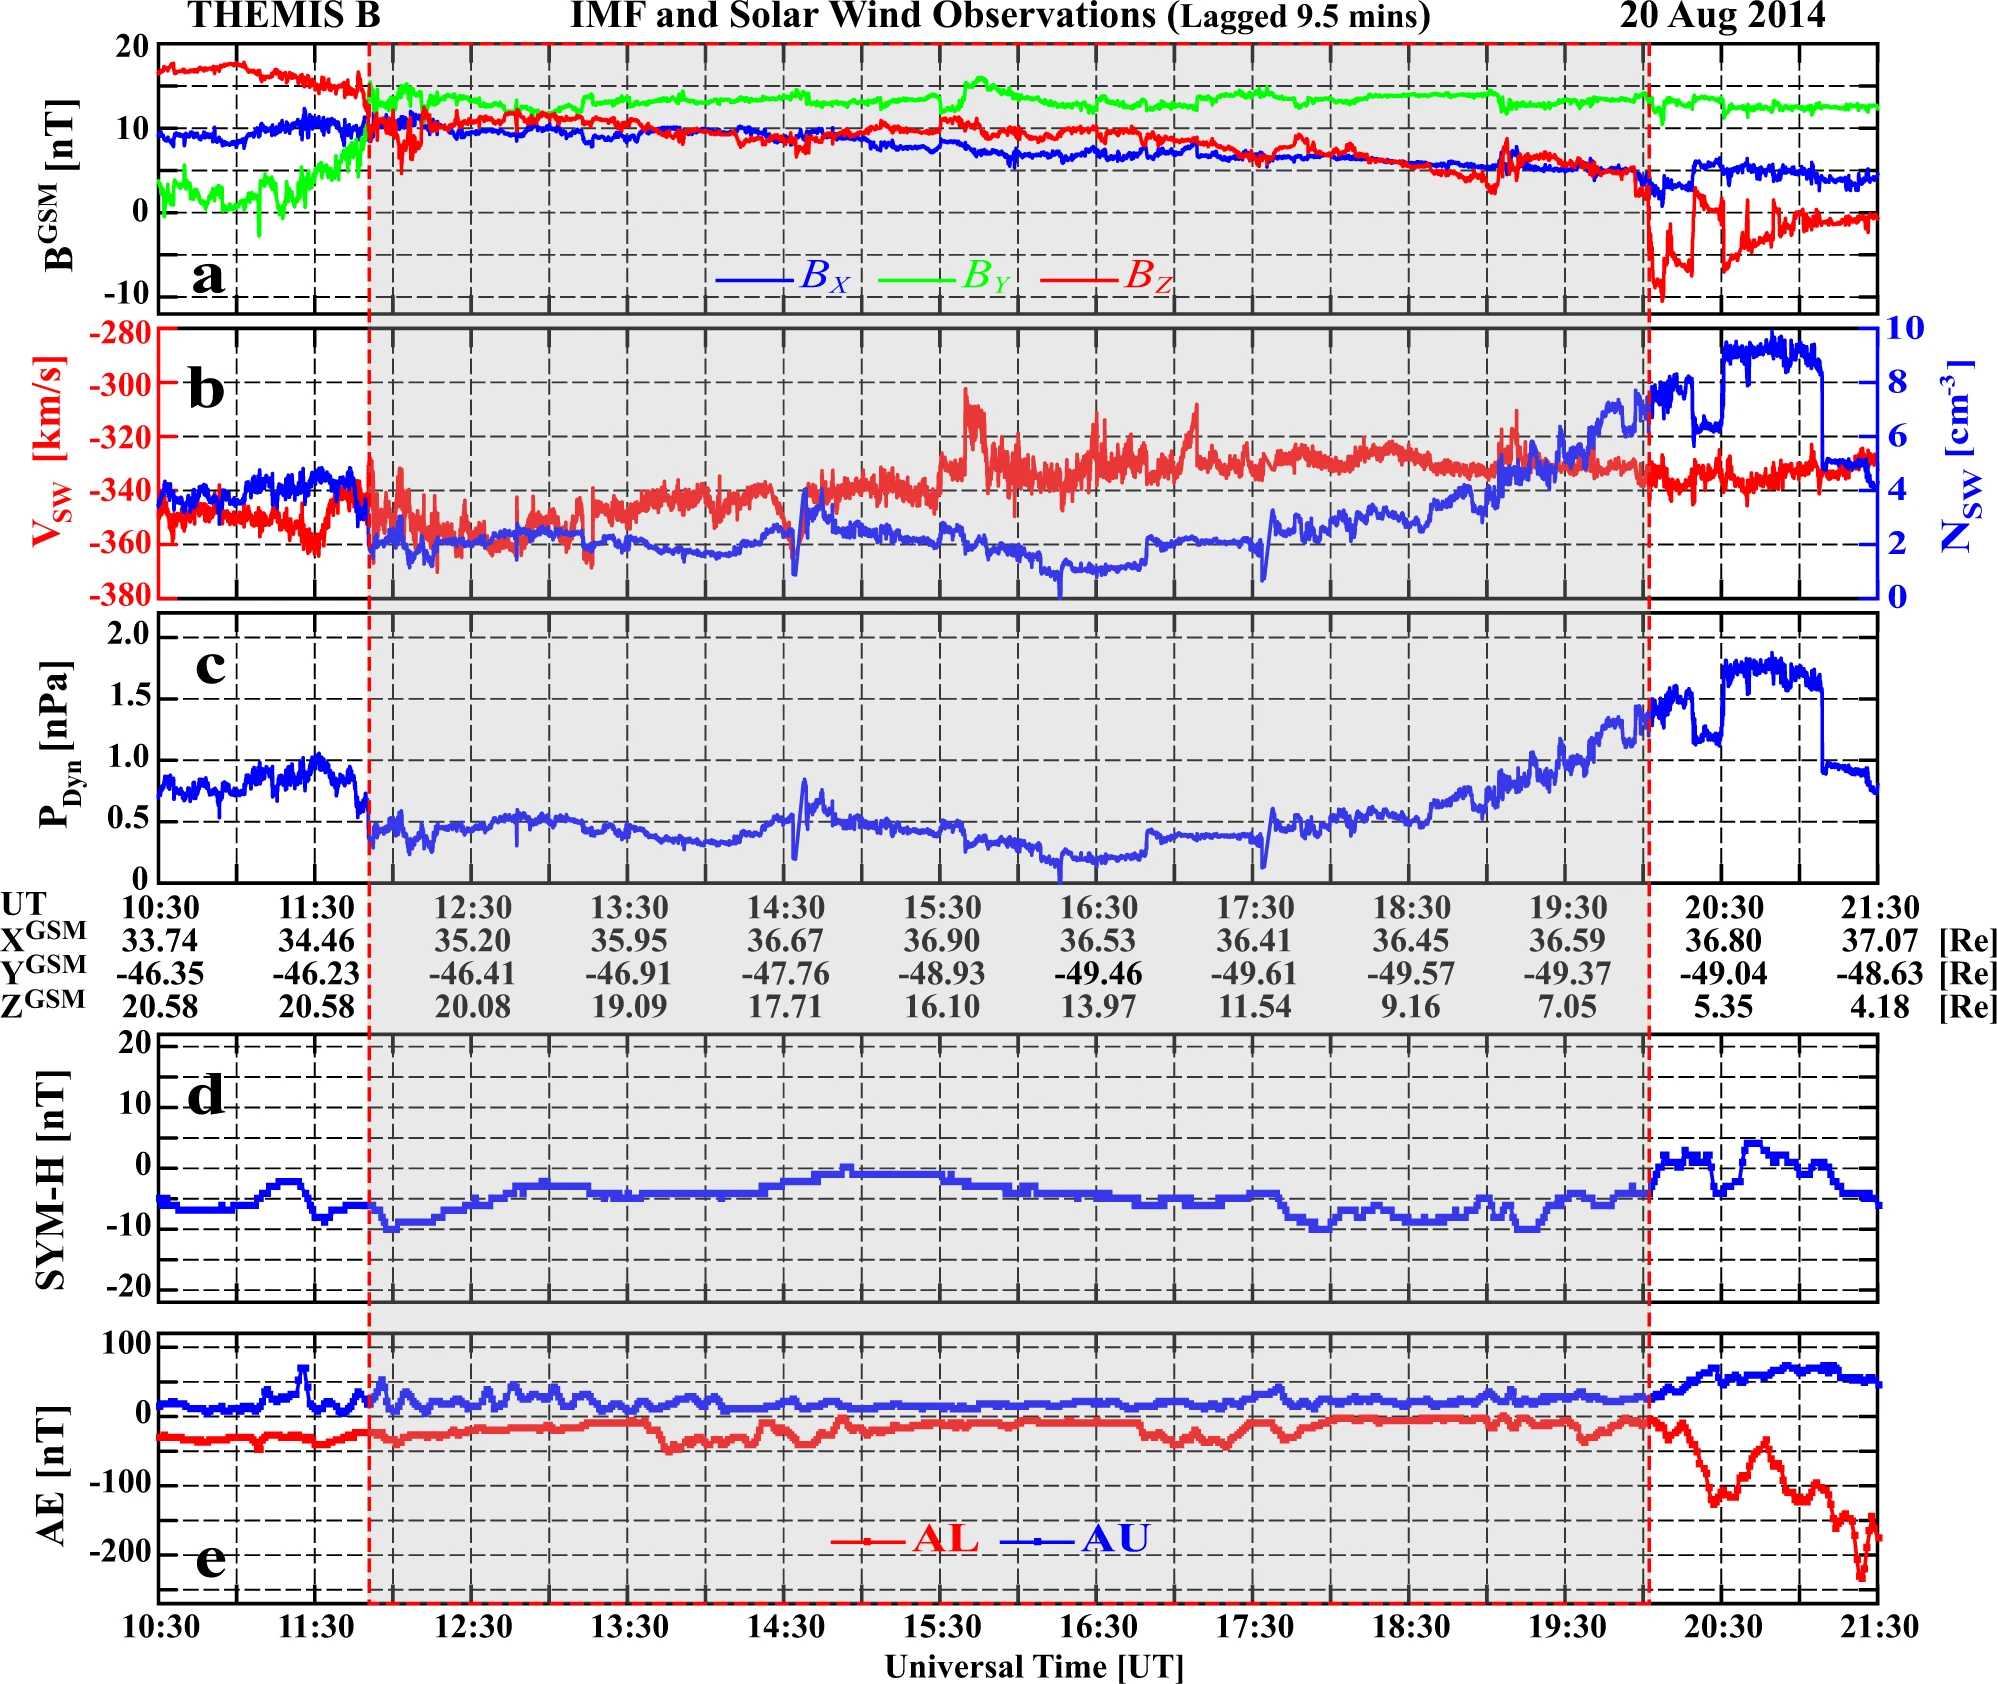 www.nature.com/articles/s41467-021-21459-y#:~:text=They%20are%20characterized%20by%20a www.nature.com/articles/s41467-021-21459-y#:~:text=They%20are%20characterized%20by%20a,hurricanes%20in%20the%20low%20atmosphere.
|
|


