|
|
Post by sigurdur on Jul 18, 2014 0:26:04 GMT
Maybe the lost IRS e-mails would show up.
|
|
|
|
Post by glennkoks on Jul 18, 2014 1:06:49 GMT
Maybe the lost IRS e-mails would show up. Nothing short of "Devine Intervention" is going to bring those emails back to life! |
|
|
|
Post by cuttydyer on Jul 21, 2014 7:43:49 GMT
The Schtick reports: New paper finds significantly more solar & less greenhouse gas climate forcing than IPCC claims over past 120 yearsA new paper published in the Journal of Geophysical Research Atmospheres finds the change in shortwave forcing from the Sun [0.76 W/m2 per decade] exceeded that of longwave forcing from greenhouse gases [0.64 W/m2 per decade] over the past 120 years in Potsdam, Germany, one of the few worldwide sites with sufficient long-term observations. The authors find water vapor alone was responsible for 3/4 of this change in longwave forcing, with only 25% of the longwave forcing [0.16W/m2 per decade, total 1.92 W/m2 over 120 years] attributable to all man-made greenhouse gases including CO2.  In contrast, the IPCC claims CO2, methane, nitrous oxide, and other man-made greenhouse gases have produced a total ~2.7 W/m2 in longwave forcing since pre-industrial times, i.e. about 29% more radiative forcing than found by the long-term observations in this new paper. The shortwave forcing from the Sun after albedo/aerosols was +9.12 W/m2 over the 120 years, 9.7 times more than the IPCC claim of negative 1.05 W/m2 forcing from the Sun + aerosols since pre-industrial times. Paper link: onlinelibrary.wiley.com/doi/10.1002/2014JD021877/abstractSchtick link: hockeyschtick.blogspot.co.uk/2014/07/new-paper-finds-significantly-more.html |
|
|
|
Post by sigurdur on Jul 21, 2014 13:05:44 GMT
This makes 100% sense cutty. Good find.
|
|
|
|
Post by sigurdur on Jul 26, 2014 13:37:09 GMT
sait.oat.ts.astro.it/MmSAI/76/PDF/969.pdfAbstract. Solar activity, together with human activity, is considered a possible factor for the global warming observed in the last century. However, in the last decades solar activity has remained more or less constant while surface air temperature has continued to increase, which is interpreted as an evidence that in this period human activity is the main factor for global warming.We show that the index commonly used for quantifying long-term changes in solar activity, the sunspot number, accounts for only one part of solar activity and using this index leads to the underestimation of the role of solar activity in the global warming in the recent decades. A more suitable index is the geomagnetic activity which reflects all solar activity, and it is highly correlated to global temperature variations in the whole period for which we have data.
|
|
|
|
Post by cuttydyer on Jul 29, 2014 7:21:21 GMT
The Schtick reports: New paper finds 'high correlation between solar activity and Earth's temperature over centuries' A new paper published in the Chinese Science Bulletin finds "high correlation between solar activity and the Earth's averaged surface temperature over centuries."  The press release states: "results demonstrate that solar activity and the Earth’s temperature have significant resonance cycles, and the Earth’s temperature has periodic variations similar to those of the solar activity (Figure 1).
The study also implies that the “modern maximum” of solar activity agrees well with the global warming of the Earth during the past century. A significant correlation between them can be found (Figure 2). Especially, the correlation between the solar activity and the ocean temperature is higher than the correlation between the solar activity and the land temperature. These results, as pointed out by a peer reviewer, “provide a possible explanation for the global warming”. This study also implies that the "modern maximum" of solar activity agrees well with the recent global warming of the Earth. A significant correlation between them can be found (Figure 2).  Link: english.cas.cn/ST/HT/ht_progress/201406/t20140617_122890.shtml |
|
|
|
Post by cuttydyer on Aug 1, 2014 7:29:10 GMT
The Schtick reports: New paper finds another potential solar amplification mechanism A paper published today in Non-Linear Processes in Geophysics, co-authored by CAGW skeptic and Professor of Geophysics Dr. Vincent Courtillot, finds a "change in regime of solar activity" during the 20th century correlated to the quasi-biennial oscillation (QBO), a wind reversal that "dominates" variability of the lower stratosphere and in turn "affects a variety of extratropical phenomena including the strength and stability of the winter polar vortex."  Solar modulation of the quasi-biennial oscillation (QBO) has also been found by several other papers, and may represent one of several proposed solar amplification mechanisms modulating climate change. According to the authors, We propose that the HSV [half-solar-cycle] behavior of the irregularity index of ISSN [International Sunspot Number] may be linked to the presence of strong QBO [quasi-biennial oscillation] before 1915–1930, a transition and their disappearance around 1975, corresponding to a change in regime of solar activity. Although the mechanism is not understood, the authors find good correlation between their "irregularity index of ISSN [International Sunspot Number]" and the strength of quasi-biennial oscillations, which "dominates variability of the lower stratosphere" and which may in turn control the jet stream and winter polar vortex that led to this winter's record US cold temperatures. 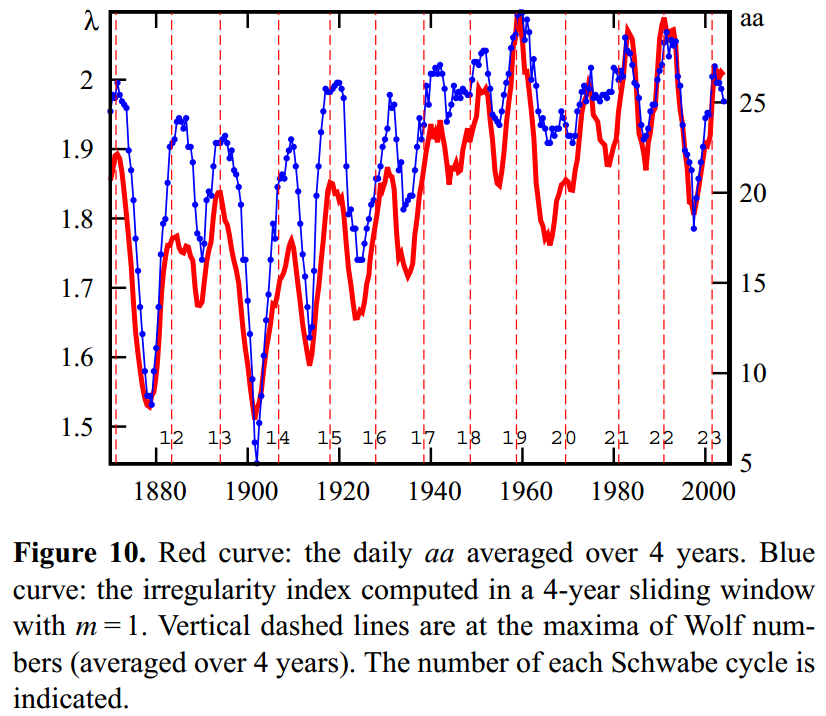 Paper link: www.nonlin-processes-geophys.net/21/797/2014/npg-21-797-2014.htmlSchtick link: hockeyschtick.blogspot.co.uk/2014/07/new-paper-finds-another-potential-solar.html |
|
|
|
Post by cuttydyer on Aug 2, 2014 6:12:17 GMT
|
|
|
|
Post by Ratty on Aug 3, 2014 0:16:53 GMT
"Weak correlation between cloud cover and cosmic ray intensity observed at a mountain."
Is "corroborates" a little strong in this case?
|
|
|
|
Post by nonentropic on Aug 3, 2014 2:31:43 GMT
Given that they are looking for say a 1% change in effective cloud cover and as far as I know there is no "normalizing" measure for the various cloud types at different locations on earth at different times per day, how can this ever be dismissed as proven or not.
Consider how confident Newton would have felt if he were alive when special relativity was first discusses and empirical data was looked for.
The southern hemisphere has a great term for this stuff "yeh right"
|
|
|
|
Post by Ratty on Aug 3, 2014 12:10:31 GMT
[ Snip ] The southern hemisphere has a great term for this stuff "yeh right" It's actually "yeah <pause> right"  |
|
|
|
Post by cuttydyer on Aug 11, 2014 6:26:36 GMT
The Schtick reports: It's the Sun Solar physicist Dr. Leif Svalgaard has revised his reconstruction of sunspot observations over the past 400 years from 1611-2013. Plotting the "time integral" of sunspot numbers from Dr. Svalgaard's data shows a significant increase in accumulated solar energy beginning during the 1700's and continuing through and after the end of the Little Ice Age in ~1850. After a ~30 year hiatus, accumulated solar energy resumes a "hockey stick" rise for the remainder of the 20th century, followed by a decline beginning in 2004, all of which show remarkable correspondence to the HADCRU3 global temperature record:  The time integral of solar activity plus ocean oscillations [which are also driven by solar activity] can explain 95% of climate change over the past 400 years. Link: hockeyschtick.blogspot.co.uk/2014/08/its-sun_9.html |
|
|
|
Post by cuttydyer on Aug 15, 2014 7:26:22 GMT
The Schtick reports: "New paper finds multiple solar amplification mechanisms which modulate winter surface temperatures."  A paper published today in the Journal of Geophysical Research Atmospheres finds "significant differences in the temperature patterns" of the Northern Hemisphere winter dependent upon the "four [phases of the solar cycle], which indicates a solar cycle modulation of winter surface temperatures." Thus, the paper describes 4 potential solar amplification mechanisms in relation to 4 phases of each solar cycle, and possibly a fifth related to solar modulation of the North Atlantic Oscillation [NAO] as has been found by prior papers. According to the authors, "Several recent studies have found variability in the Northern Hemisphere winter climate related to different parameters of solar activity. While these results consistently indicate some kind of solar modulation of tropospheric and stratospheric circulation and surface temperature, opinions on the exact mechanism and the solar driver differ. Proposed drivers include, e.g., total solar irradiance (TSI), solar UV radiation, galactic cosmic rays and magnetospheric energetic particles. While some of these drivers are difficult to distinguish because of their closely similar variation over the solar cycle, other suggested drivers have clear differences in their solar cycle evolution. For example, geomagnetic activity and magnetospheric particle fluxes peak in the declining phase of the sunspot cycle, in difference to TSI and UV radiation which more closely follow sunspots. Using 13 solar cycles (1869–2009) we study winter surface temperatures and North Atlantic oscillation (NAO) during four different phases of the sunspot cycle: minimum, ascending, maximum and declining phase. We find significant differences in the temperature patterns between the four cycle phases, which indicates a solar cycle modulation of winter surface temperatures. However, the clearest pattern of the temperature anomalies is not found during sunspot maximum or minimum, but during the declining phase, when the temperature pattern closely resembles the pattern found during positive NAO. Moreover, we find the same pattern during the low sunspot activity cycles of 100?years ago, suggesting that the pattern is largely independent of the overall level of solar activity." The authors find this "pattern [similar to the positive NAO] is largely independent of the overall level of solar activity," therefore climate scientists trying to correlate Total Solar Irradiance [TSI], which is considered by many in climate science to represent "the overall level of solar activity," will not see such patterns or even look for them or simulate them with climate models. By solely focusing on TSI and ignoring e.g. large changes solar UV of up to 100% over a single solar cycle, geomagnetic changes, ignoring all potential solar amplification mechanisms, climate models dismiss the role of the Sun in climate change. Paper link: onlinelibrary.wiley.com/doi/10.1002/2013JD021343/abstractSchtick link: hockeyschtick.blogspot.co.uk/2014/08/new-paper-finds-multiple-solar.html |
|
|
|
Post by cuttydyer on Aug 19, 2014 7:25:13 GMT
Interesting video from Suspicious0bservers: Observations from the video: . The primary concern is famine. . In the 1630s, two million people died due to famine in India. . At about the same time, huge portions of Europe developed famines, including Poland, Ireland, England, France. . In the early 1660s, India went two years without a single drop of rain. . In 1680, famine killed 80,000 people in Sardinia. . A famine in the 1690s killed 15 percent of the Scottish population. . Two million dead in France during that same period. . During the same decade, more than 100,000 peopole died in Sweden and Estonia. . At the turn of the century, two million more people died of famine in India. . Just a few years later, Eastern Prussia lost 40 percent of its population to famine. Suspicious Observers website link: www.suspicious0bservers.org |
|
|
|
Post by cuttydyer on Aug 20, 2014 6:59:27 GMT
The Schtick reports: New paper finds the Sun controls Greenland climate.  An important paper published today in Nature Geoscience finds a persistent link between solar activity and Greenland climate during the last ice age, and finds the link is similar to modern solar forcing of regional climate. According to the authors, "We suggest that solar minima could have induced changes in the stratosphere that favour the development of high-pressure blocking systems located to the south of Greenland, as has been found in observations and model simulations for recent climate. We conclude that the mechanism behind solar forcing of regional climate change may have been similar under both modern and Last Glacial Maximum climate conditions." The authors describe a solar amplification mechanism by which solar minima favor the development of high-pressure blocking systems which block the jet stream and cause increased jet stream dips of the polar vortex [just like we have seen over the past few record cold winters in the US and Europe]. Many other papers have described this solar amplification mechanism via solar effects on the stratosphere, which in turn affect the QBO, which in turn affects large scale planetary waves such as Rossby Waves and the jet stream. This is only one of many solar amplification mechanisms described in the scientific literature. The authors also provide a new reconstruction of solar activity using the cosmogenic isotope 10Be, which shows a remarkable correlation over relatively short time-scales to ice core temperatures and precipitation: 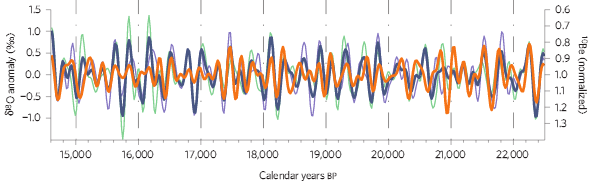 d18O [mean of 2 ice cores shown as blue line] is a proxy of temperature and precipitation. 10Be [orange line] is a proxy of solar activity [note 10Be is inversely correlated to solar activity]  Note 10Be concentration at end of 20th century was ~0.6, much less than mean of ~1 from first chart above, indicating solar activity was much greater at end of 20th century than during the last glacial maximum. Paper link: www.nature.com/ngeo/journal/vaop/ncurrent/full/ngeo2225.htmlSchtick link: hockeyschtick.blogspot.co.uk/2014/08/new-paper-finds-sun-controls-greenland.html |
|


