|
|
Post by Pooh on Aug 17, 2013 15:26:21 GMT
It is variable in UV: Lean, Dr. Judith. “Solar Spectrum, Variability, and Atmospheric Absorption.” Scientific. NASA - Science@NASA, April 6, 2011. science.nasa.gov/headlines/images/sunbathing/sunspectrum.htmNote definition as integral over entire spectrum. Note concession that extreme UV and x-ray variation > 1%. If these are absorbed by atmosphere, what happens to their energy? "At wavelengths shorter than about 300 nm, there is a relatively large variation in the Sun's extreme UV and x-ray output (greater than 1%), but the Earth's atmosphere is nearly opaque at those wavelengths. For Earth-dwelling beach-goers there is no significant difference between Solar Max and solar minimum." Note step-wise spectral irradiance below 10^2 nm. Sparse data? More information in referenced PDF: Lean, Dr. Judith. “Variations in Solar Irradiance and Climate.” Powerpoint (PDF), January 16, 2012. st4a.stelab.nagoya-u.ac.jp/nagoya_workshop_2/pdf/1-1_Lean.pdf |
|
zaphod
Level 3 Rank

Posts: 210
|
Post by zaphod on Aug 17, 2013 20:57:01 GMT
George, you refer to TSI with variations of less than a tenth of a percent. But the total radiation from the sun is over a wide range of the electromagnetic spectrum. Where X-rays are concerned they are reported on a logarithmic scale - in other words, an huge variation in energy from an A1 to an X9. So although TSI may be roughly constant, very significant parts of the sun's energy are not. And who knows exactly what impact those various parts have, where climate is concerned?
|
|
|
|
Post by georgebaxter on Aug 18, 2013 8:34:15 GMT
Hi Zaphod
I am in agreement with you. The constancy of the TSI is often used as a counter-argument against AGW.The spectral range does play differing roles at various regions in the EM spectrum. My view is that the complexity of the entire system is not know, nor are the historic data, other than those gleaned over the past couple of centuries. Temperature proxies are probably the simplest to obtain. The UV and IR history, over centuries and millenia, would probably be needed to get a better understanding. It may not be easy or even possible, and probably not much political will to look either.
My post was really to explain that the Danish high Arctic temperatures have been extra-ordinarily stable and static for 50 years, despite general global temperature rise. Clearly the mechanism that dominates the climate in the high Arctic not the same as that at, say, equatorial latitudes. And yet there are now clear signs that it is falling, not rising. I feel that the must be an explanation for that, and I would be looking initially for an extra-terrestrial source ( Solar and cosmic rays maybe ).
Have you taken a look at the Danish site, and seen what I mean about the stability, and this new dip?
Only time will tell if it sustained.
|
|
|
|
Post by Ratty on Aug 19, 2013 5:39:13 GMT
"My view is that the complexity of the entire system is not know" I think you might be onto something George Baxter.  |
|
|
|
Post by georgebaxter on Aug 19, 2013 18:26:24 GMT
"My view is that the complexity of the entire system is not know" I think you might be onto something George Baxter. Well thank you Ratty I take it you also agree with my thoughts that the high Arctic seems primarily dominated by solar effects. The sinusoidal wave form is good. And that there could be some hitherto unknown process causing that. Globally dim was only discovered by the water evapouration experiments. Whatever was holding those temperatures stable for 50 years, and is now causing them to dip, is not one that is likely to appear in the current models. Does anyone else have any thoughts about causes? Perhaps some cooling effect that is getting stronger? |
|
|
|
Post by Ratty on Aug 19, 2013 23:37:19 GMT
"My view is that the complexity of the entire system is not know" I think you might be onto something George Baxter. Well thank you Ratty I take it you also agree with my thoughts that the high Arctic seems primarily dominated by solar effects. The sinusoidal wave form is good. And that there could be some hitherto unknown process causing that. Globally dim was only discovered by the water evapouration experiments. Whatever was holding those temperatures stable for 50 years, and is now causing them to dip, is not one that is likely to appear in the current models. Does anyone else have any thoughts about causes? Perhaps some cooling effect that is getting stronger? GB, you're welcome. As far as agreeing with anything, I should point out that I am a retired school teacher with no qualifications in anything so my agreement would probably count against you.  However ................. I'm very open to anything about the Sun's influence on climate and very sceptical of the CO2 warming theory. It surprises me that anyone older than - say fifty ** - subscribes to the CO2 story. ** ie, long enough to observe a bit of weather/climate and long enough to know that the MSM is drama driven. |
|
|
|
Post by cuttydyer on Aug 21, 2013 9:09:19 GMT
I find the paper below particularly interesting; living on Dartmoor I'm surrounded by historic evidence of climate change and climate refugees. Dartmoor has an estimated 3000 stone and 6000 wooden Bronze Age round houses, with extensive ancient field boundaries or Reaves dividing up the land. Radiocarbon dating has shown that most of the Reaves were built within a 200 year period; and only in use for between 200 and 400 years.The abandonment of the Reaves and the upland moor was due to a change in climate - a significant drop in temperature and an increase in precipitation. An improvement of the climate in medieval times saw the re-occupation of the moorland fringes and river valleys. The medieval settlements crept ever higher with the rise in temperatures. Cereal farming was wide spread and crops were grown at altitudes that today would be too high to support cultivation. Dartmoor cereal farming had ceased by 1350, an increasingly cooling and wetter climate resulted in the abandonment of many villages and farms. Grimspound Bronze Age hut: 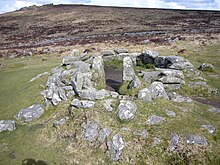 Houndtor deserted Medieval village:  __________________________________________ The in?uence of climatic change on the Late Bronze Age Collapseand the Greek Dark AgesBrandon L. Drake Department of Anthropology, University of New Mexico, Albuquerque, NM 87131, United States  Between the 13th and 11th centuries BCE, most Greek Bronze Age Palatial centers were destroyed and/or abandoned throughout the Near East and Aegean, says this paper by Brandon L. Drake. A sharp increase in Northern Hemisphere temperatures preceded the wide-spread systems collapse, while a sharp decrease in temperatures occurred during their abandonment. (Neither of which, I am sure – the increase or the decrease – were caused by humans.) Mediterranean Sea surface temperatures cooled rapidly during the Late Bronze Age, limiting freshwater ?ux into the atmosphere and thus reducing precipitation over land, says Drake, of the Department of Anthropology, University of New Mexico. This cooling and ensuing aridity could have affected areas that were dependent upon high levels of agricultural productivity. The resulting crop declines would have made higher-density populations unsustainable.  Greenland Ice Sheet Project (GISP2) Temperature (top line; Alley, 2004) and a 20-point moving average of Solar Irradiance (bottom line; Steinhilber et al., 2009) for the past5000 years. A large increase and sharp decrease in Northern Hemisphere temperatures occurred during the LBA Collapse (a). Similar (albeit smaller) temperature decreasesterminated the Roman Warm Period (b) and Medieval Warm Period (c). Low solar irradiance, periods typi?ed by low sunspot activity, are associated with cooler SSTs. Low solarirradiance occurred during the Greek Dark Ages (d), potentially contributing to continued low SSTs. This period of low solar irradiance is comparable to the more well knownMaunder Minimum (e).  Eastern Mediterranean sea surface temperatures (SST) as indicated by alkenone temperatures and warm-species formanifera. A drop of SST can indicate lower levels of evaporation, which in turn indicate less precipitation. The Ionian Sea (top line;Emeis et al., 2000) dropped by 4 deg C following the LBA Collapse (a). Temperatures returned to theirpre-LBA Collapse levels during the Roman Warm Period (b). A drop of 3 deg C during the Medieval Warm Period (c) occurs as well. Adriatic SST (second line; Sangiorni et al., 2003) dropped 1-2 deg C after the LBA Collapse (a), however a 25% reduction in Adriatic warm-species dinocysts (third line; Sangiorni et al., 2003) before the LBA Collapse (a) suggests cooling may have been rapid and severe. A similar decline in warm-species formanifera in the Aegean Sea (last line; Rohling et al., 2002) at the same time suggests signi? cantlycooler waters as well. Dark shading around lines represents 95% con?dence bands Paper link: www.academia.edu/1411970/The_Influence_of_Climatic_Change_on_the_Late_Bronze_Age_Collapse_and_the_Greek_Dark_Ages |
|
|
|
Post by sigurdur on Aug 24, 2013 2:26:06 GMT
A multiple regression analysis of the NCEP–NCAR reanalysis dataset shows a response to increased solar activity of a weakening and poleward shift of the subtropical jets. This signal is separable from other influences, such as those of El Niño–Southern Oscillation (ENSO) and the North Atlantic Oscillation (NAO), and is very similar to that seen in previous studies using global circulation models (GCMs) of the effects of an increase in solar spectral irradiance. The response to increased stratospheric (volcanic) aerosol is found in the data to be a weakening and equatorward shift of the jets. The GCM studies of the solar influence also showed an impact on tropospheric mean meridional circulation with a weakening and expansion of the tropical Hadley cells and a poleward shift of the Ferrel cells. To understand the mechanisms whereby the changes in solar irradiance affect tropospheric winds and circulation, experiments have been carried out with a simplified global circulation model. The results show that generic heating of the lower stratosphere tends to weaken the subtropical jets and the tropospheric mean meridional circulations. The positions of the jets, and the extent of the Hadley cells, respond to the distribution of the stratospheric heating, with low-latitude heating forcing them to move poleward, and high-latitude or latitudinally uniform heating forcing them equatorward. The patterns of response are similar to those that are found to be a result of the solar or volcanic influences, respectively, in the data analysis. This demonstrates that perturbations to the heat balance of the lower stratosphere, such as those brought about by solar or volcanic activity, can produce changes in the mean tropospheric circulation, even without any direct forcing below the tropopause. journals.ametsoc.org/doi/abs/10.1175/JCLI3472.1 |
|
|
|
Post by cuttydyer on Aug 24, 2013 5:30:27 GMT
A multiple regression analysis of the NCEP–NCAR reanalysis dataset shows a response to increased solar activity of a weakening and poleward shift of the subtropical jets. This signal is separable from other influences, such as those of El Niño–Southern Oscillation (ENSO) and the North Atlantic Oscillation (NAO), and is very similar to that seen in previous studies using global circulation models (GCMs) of the effects of an increase in solar spectral irradiance. The response to increased stratospheric (volcanic) aerosol is found in the data to be a weakening and equatorward shift of the jets. journals.ametsoc.org/doi/abs/10.1175/JCLI3472.1Sig, good find. I notice that this paper was published in 2005, prior to the recent episodes of meridional circulation. Link to paper pdf: journals.ametsoc.org/doi/pdf/10.1175/JCLI3472.1 |
|
|
|
Post by sigurdur on Aug 24, 2013 13:08:58 GMT
Cutty: I am still trying to figure out longer term weather patterns/climate shifts etc.
It is obvious that the CO2 hysteria has overcome most rational research and application of what is actually potentially known. I think the reason that the long outlook weather/climate failure of forecasting is that the sun is ignored.
The best thing that could happen would be for NOAA/NASA etc to get in touch with folks such as Theodore/Astromet.
His forecasts have failures, just as NOAA does. But if one could incorporate both schools, I do feel the outcome could be improved.
I farm, so climate/forecast is NO small issue with me.
|
|
|
|
Post by sigurdur on Aug 24, 2013 14:16:53 GMT
Cutty: Also, thanks for posting the link that opens the whole paper. Everybody here shows me up on their blogging abilities.
This winter I am going to try my hardest to figure out how to include pictures. I just can't seem to figure out how to do that, nor use some other features that seem to be common knowledge.
|
|
|
|
Post by sigurdur on Aug 24, 2013 16:10:35 GMT
Short-term atmospheric C14 variations measured from tree rings correlate closely with Holocene glacier and tree-line fluctuations during the last 7000 yr. Such a correspondence, firstly, suggests that the record of short-term C14 variations may be an empirical indicator of paleoclimates and, secondly, points to a possible cause of Holocene climatic variations. The most prominent explanation of short-term C14 variations involves modulation of the galactic cosmic-ray flux by varying solar corpuscular activity. If this explanation proves valid and if the solar constant can be shown to vary with corpuscular output, it would suggest that Holocene glacier and climatic fluctuations, because of their close correlation with short-term C14 variations, were caused by varying solar activity. By extension, this would imply a similar cause for Late-Wisconsin climatic fluctuations such as the Alleröd and Younger Dryas. www.sciencedirect.com/science/article/pii/0033589473900409 |
|
|
|
Post by icefisher on Aug 25, 2013 1:03:31 GMT
Cutty: Also, thanks for posting the link that opens the whole paper. Everybody here shows me up on their blogging abilities. This winter I am going to try my hardest to figure out how to include pictures. I just can't seem to figure out how to do that, nor use some other features that seem to be common knowledge. pictures are pretty easy. First, You need to copy the "image url" of the picture you want. Most browsers give you that option with a right click on the picture. If not open the picture by clicking on it and copy the url from the browser url box. The end of the URL will have a picture ending like .jpg or .png. It will always have at least a period followed by 3 characters. (.pdf) does not work as this is an adobe document. When you run into that then you have to jump through hoops, copy the picture using a snipping tool, upload it to a photo storage site then refer to it from there. Most of the time its a piece of cake. Second, you need to paste the url into your reply. third, you need to highlight the url you just pasted like you were going to copy it. fourth, you need to click the picture icon in the edit bar above your reply. Its the third icon in the 3rd group of icons and looks like a framed picture. Sixth, a popup box pops up and you need to click the insert image button and you are done. Some photo storage sites shorten the path for pictures in your storage, like photobucket. They have a one click box that copies the URL without highlighting, and when you paste it in the reply its one click paste and its done. |
|
|
|
Post by cuttydyer on Aug 27, 2013 8:31:08 GMT
Short-term atmospheric C14 variations measured from tree rings correlate closely with Holocene glacier and tree-line fluctuations during the last 7000 yr. Such a correspondence, firstly, suggests that the record of short-term C14 variations may be an empirical indicator of paleoclimates and, secondly, points to a possible cause of Holocene climatic variations. The most prominent explanation of short-term C14 variations involves modulation of the galactic cosmic-ray flux by varying solar corpuscular activity. If this explanation proves valid and if the solar constant can be shown to vary with corpuscular output, it would suggest that Holocene glacier and climatic fluctuations, because of their close correlation with short-term C14 variations, were caused by varying solar activity. By extension, this would imply a similar cause for Late-Wisconsin climatic fluctuations such as the Alleröd and Younger Dryas. www.sciencedirect.com/science/article/pii/0033589473900409For me, this graph says it all...  |
|
zaphod
Level 3 Rank
Posts: 210
|
Post by zaphod on Aug 27, 2013 12:44:38 GMT
All good stuff! IMAGE CONVERSION If anyone is interested, I use and am very happy with a free image converter, which will convert any printable document like .doc, .jpg or .jpeg, .pdf, .bmp and so on into anything else. I use it to convert files to .jpg on my laptop and print using the "walk-up" print facility on my printer, which prints only .jpg that way - without having to fire up the desktop. Very useful I find for converting .doc and .pdf to .jpg. May have a use on this page. Have a look here: code-industry.net/imageprinter.phpThat one is free, and does all I need. They have a super-duper paid one as well. |
|


 However ................. I'm very open to anything about the Sun's influence on climate and very sceptical of the CO2 warming theory.

