|
|
Post by Ratty on Jan 16, 2017 6:03:03 GMT
|
|
|
|
Post by sigurdur on Jan 21, 2017 18:05:28 GMT
"It could mean that sea levels will respond faster" to global warming, he told Reuters. He added that there were still many uncertainties about inferring rates of sea level rise from the pre-historic temperatures. On Wednesday, the U.N.'s World Meteorological Organization said that average global surface temperatures hit a record high in 2016 for the third year in a row and were 1.1 degree Celsius (2.0°F) higher than in pre-industrial times www.businessinsider.com/r-ancient-warm-period-hints-at-bigger-than-expected-sea-level-rise-2017-1 |
|
|
|
Post by Ratty on Feb 6, 2017 11:18:56 GMT
125 years of unprecedented sea level rise? Sandgate, Queensland, Australia:  
|
|
|
|
Post by missouriboy on Feb 6, 2017 14:30:35 GMT
125 years of unprecedented sea level rise? Sandgate, Queensland, Australia: Ratty ... where'd you get all that fill material? Marvelous work.  |
|
|
|
Post by sigurdur on Feb 6, 2017 19:09:46 GMT
125 years of unprecedented sea level rise? Sandgate, Queensland, Australia: How big were the jacks that raised the building several times? Or is the building site on an area that had a glacier, and we are observing iso rebound? Or....is the foundation rising? Or.....has sea level just not risen a whole lot? But Ratty!!! In another 100 years there "may" be water lapping at the fence! |
|
|
|
Post by sigurdur on Feb 7, 2017 0:28:21 GMT
|
|
|
|
Post by missouriboy on Feb 7, 2017 2:18:50 GMT
Hey! It's an exclusive club, Not just anybody can get in. You've got to feel the 'berm'. |
|
|
|
Post by sigurdur on Mar 13, 2017 18:25:45 GMT
insideclimatenews.org/news/10032017/global-warming-oceans-climate-change-noaaThe researchers used data from a network of 3,500 robotic floats that measure ocean temperatures and salinity to a depth of 2,000 meters. The Argo floats, operated by the World Climate Research Program, were first used in 2000. About 800 floats are now deployed every year, widely dispersed across the world's oceans.
|
|
|
|
Post by missouriboy on Mar 14, 2017 14:55:44 GMT
insideclimatenews.org/news/10032017/global-warming-oceans-climate-change-noaaThe researchers used data from a network of 3,500 robotic floats that measure ocean temperatures and salinity to a depth of 2,000 meters. The Argo floats, operated by the World Climate Research Program, were first used in 2000. About 800 floats are now deployed every year, widely dispersed across the world's oceans. Must be two Argos. Or perhaps they've added something for that rapidly warming Arctic ocean (~4% of world ocean area). Or perhaps they've been popping peyote under the desert moon. Or perhaps I just don't get it ... because the slope of the Argo-derived monthly temperature deviations from the 2004-15 monthly means for depths of 0-2000 meters for the whole globe (graphs below) doesn't look anything like that dangling end on their graph. Must be about a 50% increase (measured by eyeball) in joules over the 2004-15 period. You'll note that the actual Argo data seem to show what would amount to ~0.5 C per century from 2004 to 2015. Through 2016 that rate would be about 0.25 C per century. Their graph looks really scary, right?  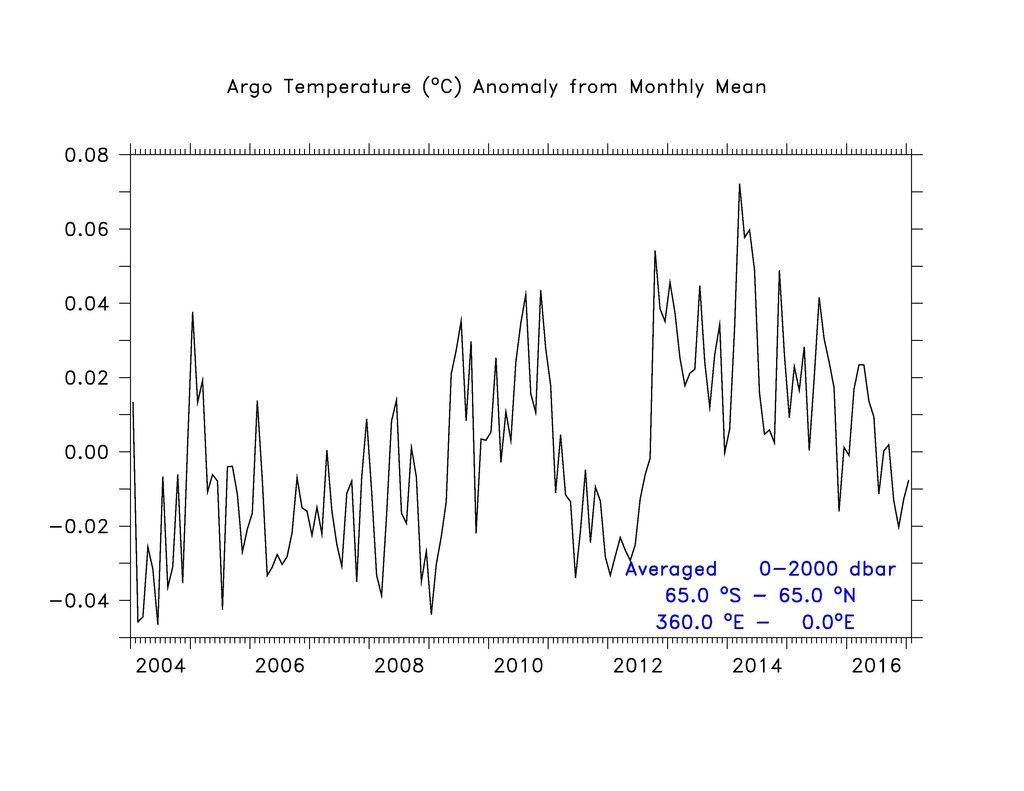 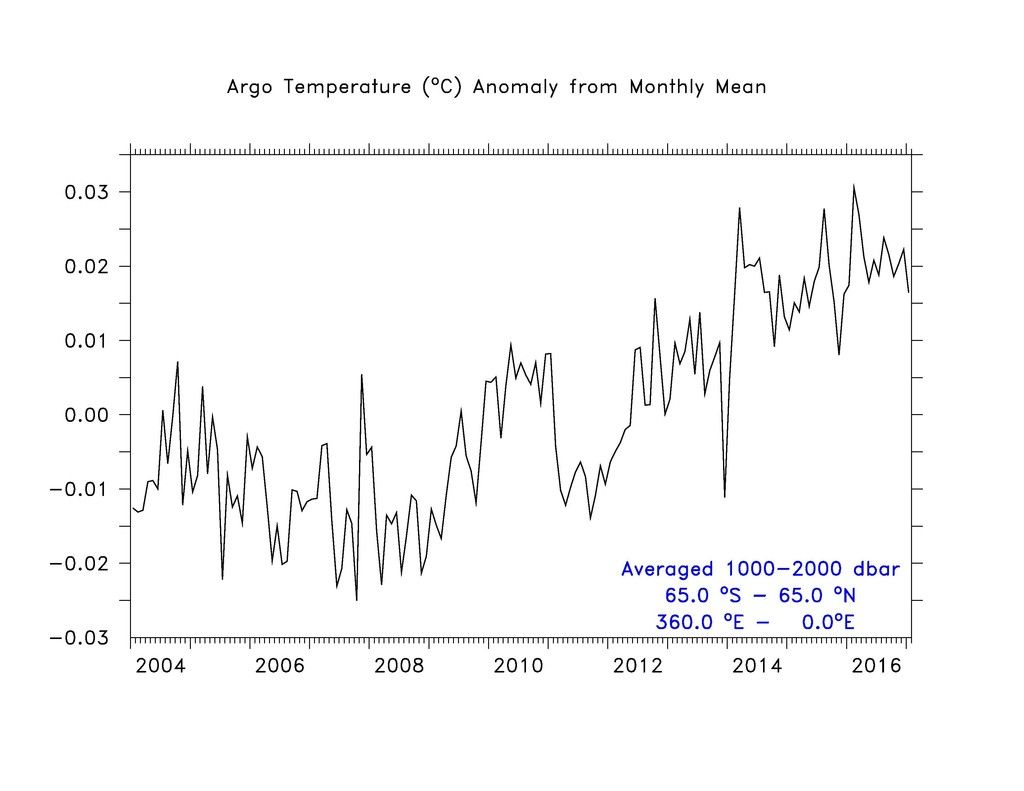 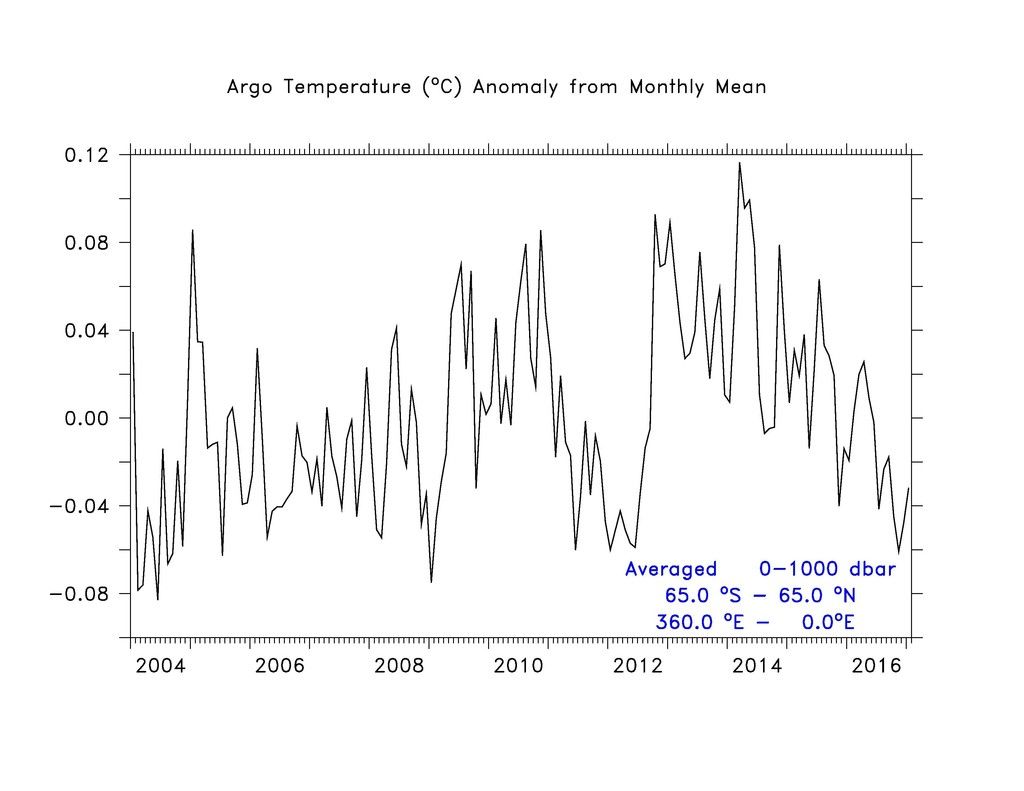 |
|
|
|
Post by sigurdur on Mar 14, 2017 16:59:13 GMT
I am shaking out of my boots! Going to have to get waders pretty soon!
Its all in presentation.
I am not selling my coat any time soon. IN fact, I hope to wear a few more out!
|
|
|
|
Post by Ratty on Mar 14, 2017 22:49:05 GMT
0 -> 1000 and 0 -> 2000 look practically identical to me. How does the 1000 -> 2000 graph fit in that scenario?
Be gentle ....
|
|
|
|
Post by missouriboy on Mar 15, 2017 3:17:24 GMT
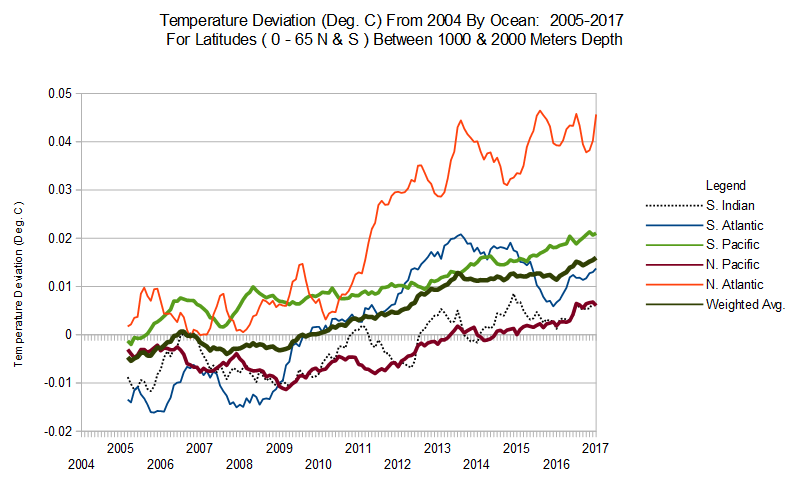
0 -> 1000 and 0 -> 2000 look practically identical to me. How does the 1000 -> 2000 graph fit in that scenario? Be gentle .... Since 'the boys' referred to greater heating at depth, I threw in the two halves. We have noted this heating at greater depth before, but it is rather small and does not dramatically affect the 0-2000 m graph. They found that the warming accelerated in the mid-1970s. In the 1990s, the warming spread to deeper waters, from 700 to 2,000 meters. The biggest increases in ocean heat content were in those deeper layers, showing "that the deep ocean has played an increasingly important role in the ocean energy budget since 1998," according to the study.Makes one wonder where they got a large enough sample of those deeper waters prior to Argo to make any reasonable guesstimate. But here you have it passed down like the 11th commandment, although they do give it some wide error bars. May take a Houdini to figure out this data model, but my guess is that any 'sanitary' engineer could provide an opinion as to where it came from. But I'm being rude and if I'm wrong, someone please correct me.
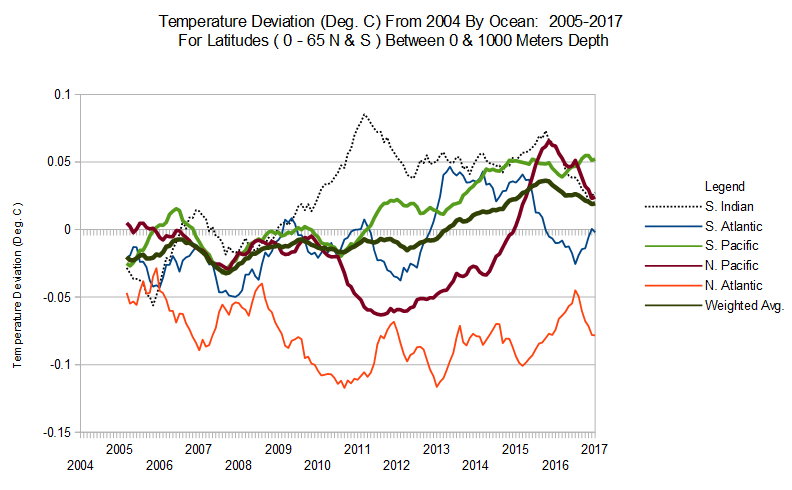
As a followup I tallied the following two graphs from Argo data for 5 oceans from Jan. 2004 to Jan. 2017. Month-specific deviations from 2004 were plotted as 13-month running averages for each ocean. The mean for all oceans was weighted by ocean-specific surface area. In Jan. 2017 mean temperatures for 5 oceans deviated from Jan. 2004 by +0.02 C at 0-1000 meters and +0.015 C at 1000-2000 m. These produce very scary rates of 0.15 C and 0.12 C per century. Does all that heat get amplified when released to the atmosphere?
|
|
|
|
Post by sigurdur on May 23, 2017 15:33:44 GMT
|
|
|
|
Post by missouriboy on May 23, 2017 16:51:52 GMT
Their mantra states that "Democracy Dies in Darkness". Then they tell me that I must "pay for the light".  My electric company tells me the same thing ... "Pay up or freeze in the dark".  |
|
|
|
Post by douglavers on May 24, 2017 3:47:32 GMT
"added in major contributions from the ice sheets of Greenland and Antarctica." [referring to melting ice].
I thought the mass balance of Greenland was hugely positive at present.
I have seen no suggestion anywhere that the land based ice mass of Antartica is doing much of anything. I understand the continent has been net cooling for three decades.
|
|


 My electric company tells me the same thing ... "Pay up or freeze in the dark".
