|
|
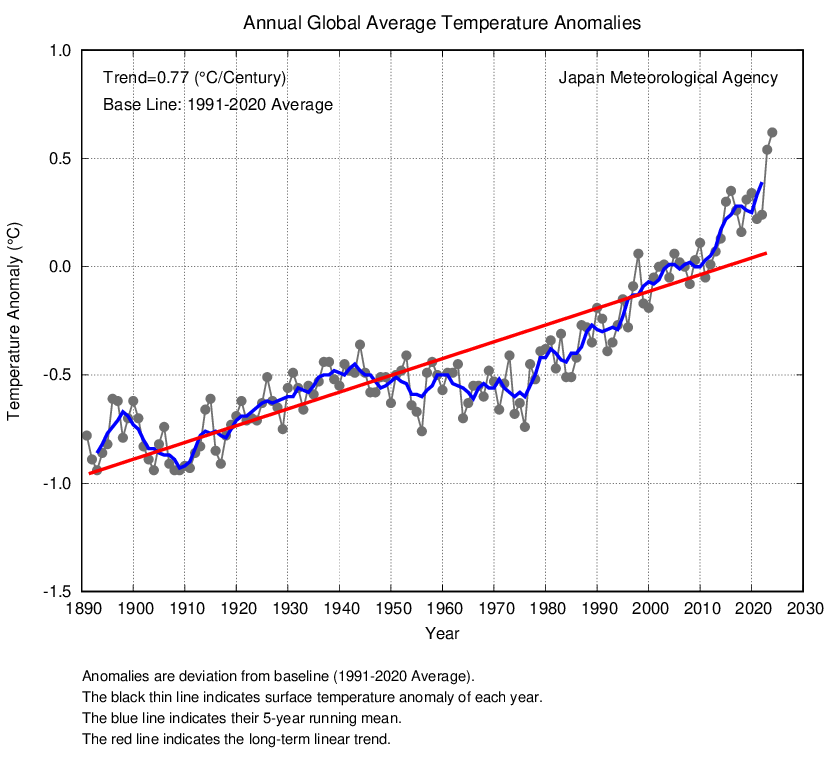
Post by Ratty on Jan 6, 2015 23:19:58 GMT
|
|
|
|
Post by sigurdur on Jan 7, 2015 1:36:58 GMT
Ratty: Your graph must be wrong. Only since 1975 has it warmed............remember? Or...........oooooopppsss. Only since 1975 has CO2 been the driver of warming. Heck, if we keep warming we might get close to the MWP temps. And ya know, we just can't have that! |
|
|
|
Post by sigurdur on Jan 7, 2015 2:06:54 GMT
|
|
|
|
Post by graywolf on Jan 7, 2015 17:50:14 GMT
|
|
|
|
Post by icefisher on Jan 7, 2015 20:44:41 GMT
So now we ignore the decades old measure of what is and isn't a Nino because of local weather??? It was a Nono year not a Nino year!!! Now it might be the the worlds oceans have stopped taking heat down deep ( and giving the atmosphere a chance to absorb it) but what happens when you have that AND a release of the heat that was trapped over the past ( apparently) 18 years 3 months??? ( no Nino needed as we saw the past year)  ? Lets see how Nino acts this year and how temps fare eh? I know you Guys have whipped the arse off the 98' Super Nino and its impacts on global temps but an ENSO Neutral year has just bested that ( whilst still deep within negative naturals..... unless some ones going to call PDO positive on the strength of the past year of positive figures?). How many ways do you Guys want it eh? It might be impressive if the satellite temperature records agreed with Phil "Hide the Decline" Jones' record. But it doesn't. 2014 slipped into 3rd place barely in the satellite record as was a full .15degC cooler on average than 1998 and .13degC cooler than 2010. Perhaps if we had had an El Nino and the equatorial Pacific was also anomalously warm we would have had a record year but we didn't. UAH Satellite top ten years. 1. 1998 0.42 2. 2010 0.40 3. 2014 0.27 4. 2005 0.26 5. 2013 0.24 6. 2002 0.22 7. 2009 0.21 8. 2007 0.20 9. 2003 0.19 10. 2006 0.19 |
|
|
|
Post by icefisher on Jan 7, 2015 21:10:56 GMT
Only problem with the Francis paper is in the assumptions Jennifer starts with and does not personally verify in the paper, that changes in arctic temperatures are due to the increase in CO2. Fact is we have seen many examples of severe winter weather throughout history that has nothing at all to do with CO2. Since satellites did not exist we have no information on changing jet streams and so forth, however, severe winter weather does not just materialize out of nothing and its only faith to assume so. The Francis work does a good job on what it actually tests and definitely adds to our knowledge, but because we do not have a good understanding of natural variation in these patterns. en.wikipedia.org/wiki/1936_North_American_cold_waveLets just say scientists like to put as much marketing in their studies and industry does in its products. If one cannot read a science study and determine what was tested and what was not even looked at. . . .sell as they say caveat emptor! May as well buy a pig in a poke without looking at the pig. |
|
|
|
Post by icefisher on Jan 7, 2015 21:20:30 GMT
Actually 2015 should be warmer than 2014 and may rival the top two years and 2016 may also. But borrowing one of the few shards of wisdom that has come out of the CAGW movement, 2 years of anomalous weather is meaningless.
|
|
|
|
Post by sigurdur on Jan 8, 2015 2:37:28 GMT
What Dr. Francis is trying to explain is a phenomina that has happened repeatedly in the past. For her idea to have veracity, it requires acknowledgement of past events, and then she has to tell us how current events are any different than past events. Correlation is not causation. The inability to explain past knowns, yet thinking she can explain present observations doesn't work for me, and hopefully, doesn't work for you. |
|
|
|
Post by sigurdur on Jan 8, 2015 2:40:22 GMT
There is a reason that the low temperature record in many areas of the USA is a product of the 1930's.
And there must be a reason that the largest blizzard/snow storm/cold length spells happened during the 1800's in the USA.
Could it correlate with declining Arctic Sea Ice area? Potentially, as the mid 1940's was the last low ice area until now.
She needs a longer time frame in her discoveries don't you think?
|
|
|
|
Post by sigurdur on Jan 8, 2015 2:45:28 GMT
|
|
|
|
Post by Ratty on Jan 8, 2015 4:03:10 GMT
|
|
|
|
Post by missouriboy on Jan 10, 2015 20:25:35 GMT
Sigurdur Have you run across any references to proxy research on temperature and precipitation patterns during the Little Ice Age applicable to my area of the mid-west (mid-Missouri just north of the Missouri River)? I have found some very general references to shorter growing seasons and drought for this period in the general geographic area. Any sources would be appreciated. There was a paper published a few years ago concerning North America. What you indicate is what my memory agrees with. The author was a fellow from Ontario. Remind me during the weekend and I will see if I can find it. Reminding as requested. Thanks Sig. |
|
|
|
Post by sigurdur on Jan 10, 2015 23:19:37 GMT
|
|
|
|
Post by sigurdur on Jan 10, 2015 23:25:03 GMT
www.sciencedirect.com/science/article/pii/S0921818111001500The temperature of the warmest month was reconstructed for the past 2000 years using 748 pollen sites from the North American Pollen Database. The Modern Analog Technique was used to quantify paleoclimate conditions using a modern pollen database with calibration sites from across North America. Across North America, both the Medieval Warm Period (MWP) and Little Ice Age (LIA) were cooler than the present (AD 1961–1990). The MWP was warmer than the LIA over at least the boreal and eastern portions of the continent and perhaps across the continent. These reconstructed anomalies during the MWP and LIA are significant anomalies from the long-term neoglacial cooling. The atmospheric circulation was likely dominated by a poleward shift of the summer Subtropical High Pressure system in the North Atlantic during the MWP.
|
|
|
|
Post by cuttydyer on Jan 11, 2015 7:34:19 GMT
www.sciencedirect.com/science/article/pii/S0921818111001500The temperature of the warmest month was reconstructed for the past 2000 years using 748 pollen sites from the North American Pollen Database. The Modern Analog Technique was used to quantify paleoclimate conditions using a modern pollen database with calibration sites from across North America. Across North America, both the Medieval Warm Period (MWP) and Little Ice Age (LIA) were cooler than the present (AD 1961–1990). The MWP was warmer than the LIA over at least the boreal and eastern portions of the continent and perhaps across the continent. These reconstructed anomalies during the MWP and LIA are significant anomalies from the long-term neoglacial cooling. The atmospheric circulation was likely dominated by a poleward shift of the summer Subtropical High Pressure system in the North Atlantic during the MWP. Sig, Great find - to enable future reference, I've placed a link to this paper in the "Sun's Influence" thread. |
|


 ?
?

