|
|
Post by walnut on May 9, 2019 22:38:31 GMT
I think that some of them do know, somewhere in the back of their minds, that their scam will run out of time at some point. Will justice be waiting? Wouldn't that be great? |
|
|
|
Post by Ratty on May 9, 2019 23:08:51 GMT
I think that some of them do know, somewhere in the back of their minds, that their scam will run out of time at some point. Will justice be waiting?  |
|
|
|
Post by nautonnier on May 11, 2019 11:19:44 GMT
A very interesting post from Chiefio. He has at great length compared GHCN 3.3 with GHCN 4.0 and the results are not good. If this was a forensic audit of financial books someone would be in real trouble by now. "Wow! Just wow. A full 1 C of “cooling of the historical record”, then about 1/4 C cooling in the middle, and a bit of warming at the end. So while the news from Mongolia has been about historic losses of cattle due to the very severe cold, the GHCN is claiming it is the hottest ever. I don’t believe it.
Note that the Anomaly graph has an expanded range. The central continent areas are prone to wider temperature ranges. So according to these anomalies, it was about 5 C colder than now up to the 1950s… yet we’re having the nomadic herdsdmen threatened by cold now. Reality and the data diverge.
Then there’s just the question of causality. CO2 is supposed to account for about 1/2 C to at most 1 C of warming. Here we’ve got 5 C. So what caused the other 4 C of warming? Might it have caused the whole 5 C?"chiefio.wordpress.com/2019/05/11/ghcn-v3-3-vs-v4-asia-anomaly/I think Acid and Moboy will find it very interesting. Strangely- back on the 'old board' I can remember a 'discussion' with SoCold on his claim that Mongolia was warm look at GHCN; at the same time as cattle were dying in large numbers due to severe cold. "which do we believe?" |
|
|
|
Post by nautonnier on May 16, 2019 9:25:26 GMT
|
|
|
|
Post by missouriboy on May 16, 2019 13:29:07 GMT
Saved for Posterity Right Here  Or until Videogeddon. And it was posted in 2016, so the current wet year is "just weather" I guess. Or perhaps it is how that increased water vapor concentration (and its associated heat content) in the troposphere released from our planet"s liquid thermal reservoir over a period of "high solar" activity gets "wrung out" along dynamic atmospheric circulation edges, and the excess heat content sent off to space. |
|
|
|
Post by nautonnier on May 17, 2019 20:15:34 GMT
"What Difference Does Instrument Selection Make To Anomaly Processed Temperature Data?
They, “Climate Scientists” and supporters of Global Warming, claim that since their dire claim of warming is all “done with anomalies” the actual instruments used does not matter. Complaints about instrument change causing problems are often summarily dismissed, often with sneers and jeers, as being ignorance. Here I show otherwise. Instrument selection DOES change the anomalies produced."chiefio.wordpress.com/2019/05/16/what-difference-does-instrument-selection-make-to-anomaly-processed-temperature-data/
|
|
|
|
Post by missouriboy on May 18, 2019 20:00:49 GMT
From Joe today. I had been wanting one of these graphs. 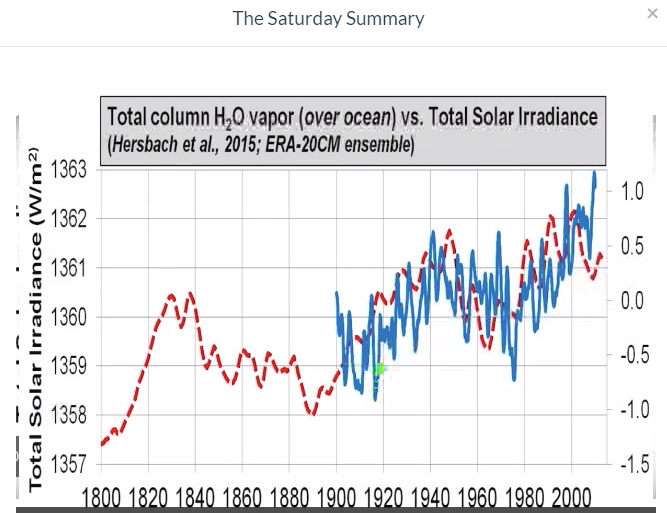  |
|
|
|
Post by mondeoman on May 18, 2019 21:45:43 GMT
Now overlay anthropogenic co2, or even just atmospheric co2.
I'm betting there's zero correlation.
|
|
|
|
Post by missouriboy on May 18, 2019 22:13:05 GMT
Now overlay anthropogenic co2, or even just atmospheric co2. I'm betting there's zero correlation. Joe found the REAL culprit. 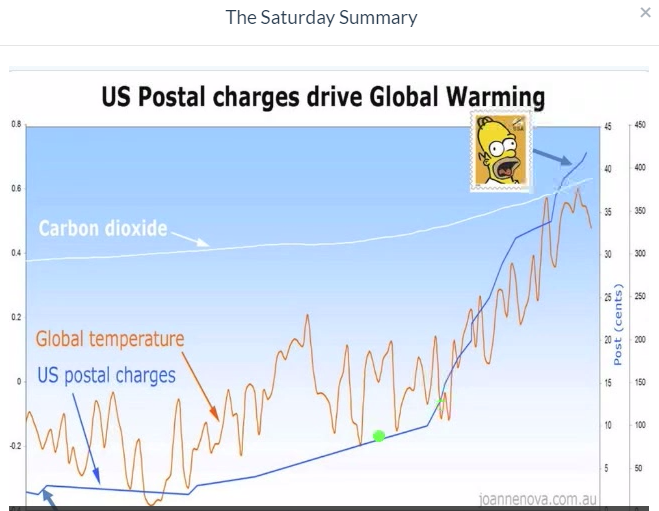 |
|
|
|
Post by nautonnier on May 19, 2019 12:29:18 GMT
Things in the GHCN have moved from poor governance, to lack of ethics to outright fraud.... "Dijibouti – Why? What Changed?
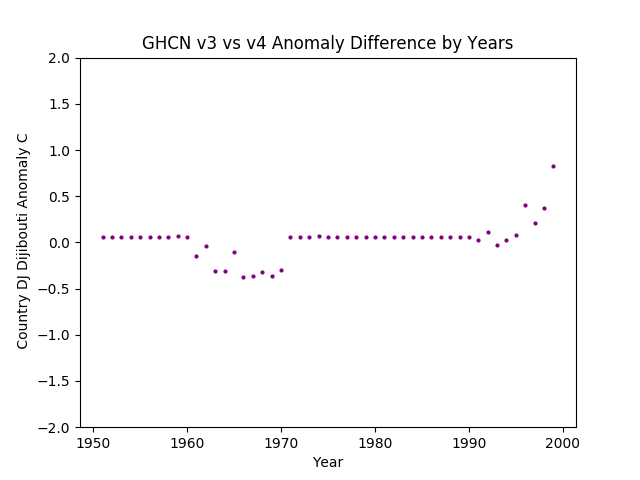
......There’s only one damn thermometer in the whole country.
All those early years have 12 records. What on earth would justify changing historical data from the same instrument? Every Single Year is DIFFERENT between v3.3 and v4. This is just a flat out Data Diddle.
In the recent end, when temperatures go a bit wild, we also lose about 1/2 the monthly records. Anyone want to bet they kept the ones in warm months?"chiefio.wordpress.com/2019/05/18/dijibouti-why-what-changed/ |
|
|
|
Post by missouriboy on May 19, 2019 14:49:44 GMT
Doe anyone on this forum know of a freeware statistical package or app that will calculate weighted distances between observations? I have estimates of genetic distance between 20 men, thus 400 discrete distances, and want to place each of them in relation to the whole.
|
|
|
|
Post by walnut on May 19, 2019 14:56:08 GMT
They should tap that thermometer with a wrench, it's out of whack Things in the GHCN have moved from poor governance, to lack of ethics to outright fraud.... "Dijibouti – Why? What Changed?
......There’s only one damn thermometer in the whole country.
All those early years have 12 records. What on earth would justify changing historical data from the same instrument? Every Single Year is DIFFERENT between v3.3 and v4. This is just a flat out Data Diddle.
In the recent end, when temperatures go a bit wild, we also lose about 1/2 the monthly records. Anyone want to bet they kept the ones in warm months?"chiefio.wordpress.com/2019/05/18/dijibouti-why-what-changed/ |
|
|
|
Post by walnut on May 19, 2019 14:57:48 GMT
Doe anyone on this forum know of a freeware statistical package or app that will calculate weighted distances between observations? I have estimates of genetic distance between 20 men, thus 400 discrete distances, and want to place each of them in relation to the whole. Does the free trial version of matlab do it? |
|
|
|
Post by nautonnier on May 19, 2019 16:33:40 GMT
Doe anyone on this forum know of a freeware statistical package or app that will calculate weighted distances between observations? I have estimates of genetic distance between 20 men, thus 400 discrete distances, and want to place each of them in relation to the whole. You could try "R" the statistical language it is one of the Gnu set of languages. see www.r-project.org/about.htmlThat would mean building your own but then at least you know what it's doing. |
|
|
|
Post by nautonnier on May 19, 2019 17:59:34 GMT
|
|


 Or until Videogeddon. And it was posted in 2016, so the current wet year is "just weather" I guess. Or perhaps it is how that increased water vapor concentration (and its associated heat content) in the troposphere released from our planet"s liquid thermal reservoir over a period of "high solar" activity gets "wrung out" along dynamic atmospheric circulation edges, and the excess heat content sent off to space.