|
|
Post by sigurdur on Nov 19, 2017 15:28:13 GMT
I.dont.like.your.graphs.
|
|
|
|
Post by sigurdur on Nov 19, 2017 15:29:06 GMT
Ok, I love your graphs! I don't like what they are showing.
|
|
|
|
Post by missouriboy on Nov 19, 2017 16:03:18 GMT
Ok, I love your graphs! I don't like what they are showing. All the World's a stage. And all the talking heads are passing gas ... (apologies to WS) |
|
|
|
Post by missouriboy on Dec 6, 2017 16:13:58 GMT
In a search of Wattsupwiththat I ran across this ... dealing with the decoupling of land and ocean temperatures. Seemed worth re-visiting. Is that even possible? And, if so. what would be the mechanism? wattsupwiththat.com/2013/05/05/by-land-and-by-sea/ |
|
|
|
Post by blustnmtn on Dec 6, 2017 16:36:01 GMT
In a search of Wattsupwiththat I ran across this ... dealing with the decoupling of land and ocean temperatures. Seemed worth re-visiting. Is that even possible? And, if so. what would be the mechanism? wattsupwiththat.com/2013/05/05/by-land-and-by-sea/My first thought was UHI, but that comes under the heading of a “WAG” as opposed to a “SWAG”. |
|
|
|
Post by sigurdur on Dec 17, 2017 18:16:55 GMT
diagrammonkey.wordpress.com/2017/12/17/an-ongoing-review-of-sea-surface-temperature-things/Victor Venema had me thinking about publication. You should probably go and read all the wonderful things he’s written on this subject rather than read what follows, but I’m going to say it anyway. Some time ago, I wrote a review on uncertainty in in situ* measurements and data sets of sea-surface temperature, SST. It started life as a literature review that I put together while I was working on the HadSST3 data set. I tidied it up and put it on the web to provide a bit of context for the HadSST3 data set and papers, which talk about uncertainty through the specific lens of that data set, but not uncertainty in a more general (and useful) sense. After a while, it seemed that people were referring (informally, via blogs and such) to the essay more often than they were the HadSST3 papers, sometimes to the extent of confusing the two. Based on this, I felt like the essay might be something that could be usefully published. So, that’s what I did: I published it as a peer-reviewed articl
|
|
|
|
Post by nautonnier on Jan 25, 2018 12:36:19 GMT
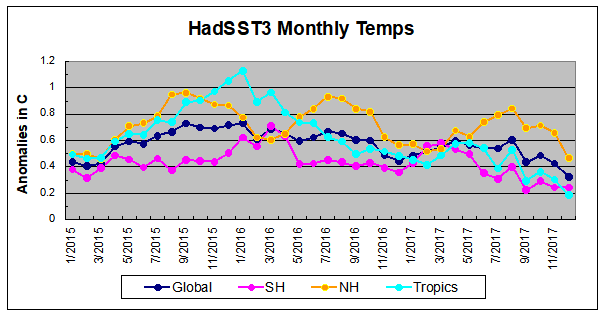
"After a bump in October the downward temperature trend has strengthened. As will be shown in the analysis below, 0.4C has been the average global anomaly since 1995 and December has now gone lower to 0.325C. NH dropped sharply along with the Tropics. SH held steady erasing the Oct. bump. All parts of the ocean are clearly lower than at any time in the past 3 years."rclutz.wordpress.com/2018/01/18/oceans-cool-off-previous-3-years/ |
|
|
|
Post by mondeoman on Jan 25, 2018 17:00:02 GMT
But last year was the hottest damn hot year in recorded hot history!! The oceans can’t be cooling, its a lie!
|
|
|
|
Post by nautonnier on Jan 25, 2018 17:05:02 GMT
But last year was the hottest damn hot year in recorded hot history!! The oceans can’t be cooling, its a lie! I suspect there may be a lot of people that are quite upset with the cooling that seems to be on the cards if not happening. A lot now depends on what the summer is like in the Northern Hemisphere. Don't expect much support from the Gulf Stream/North Atlantic Drift though - I can assure you from the Gulf of Mexico end the water is _not_ warm. You can tell that when people have to go out and harvest floating frozen turtles and the nuclear power station warm out flow is full of manatees |
|
|
|
Post by missouriboy on Jan 25, 2018 19:57:00 GMT
But last year was the hottest damn hot year in recorded hot history!! The oceans can’t be cooling, its a lie! They are trying hard to keep the temperatures in their US climate divisions data base going up ... together with other World stations and the ones where no one lives. These feed the algore-rythems that support the contention that each year is the hottest year evah. As temperatures drop, they will struggle to keep the US base, and soon perhaps Europe, from offsetting the unwatched increases elsewhere. Thus the maps that show "blue anomalies" centered only in the eastern half of the US and the western edge of Europe ... surrounded by a sea of "red". This shell game must ultimately collapse if the downturn continues. And we seem to be seeing a small shift in the messaging to "mild cooling" for only a brief period. Crooks are often caught by the sloppiness of their work ... and these guys have left a LOT of evidence in their wake. If the pressure is increased, the weakest links in the chain may break ... the lowly ones that actually changed the data. May a long rope find their scrawny little necks. |
|
|
|
Post by acidohm on Feb 7, 2018 16:51:26 GMT
But last year was the hottest damn hot year in recorded hot history!! The oceans can’t be cooling, its a lie! I suspect there may be a lot of people that are quite upset with the cooling that seems to be on the cards if not happening. A lot now depends on what the summer is like in the Northern Hemisphere. Don't expect much support from the Gulf Stream/North Atlantic Drift though - I can assure you from the Gulf of Mexico end the water is _not_ warm. You can tell that when people have to go out and harvest floating frozen turtles and the nuclear power station warm out flow is full of manatees It's a very interesting development at the 'source' of the g stream....biggest change in 3 years or so.... |
|
|
|
Post by nautonnier on Feb 12, 2018 10:31:04 GMT
 It is summer in the Southern Hemisphere -but you wouldn't know it from the Anomalies chart. Note that the not a La Nina has now almost joined up for a complete equatorial cold anomaly. At the same time phoenix like the gulf stream has restarted despite the waters around Florida being cold. |
|
|
|
Post by missouriboy on Feb 12, 2018 13:32:12 GMT
Yesterday I saw this fellow in a Starbucks and I thought he looked familiar so I said hello. Yes, I was right, it was The Dude. Far out dude! We had a nice conversation talking about his hobby which is taking the water temperature of Puget Sound, something he's done for the past 25 years, bummer was he told me his 25 years worth of data is all hand written. I was able to dig up some old stories on The Dude for ya all. patch.com/washington/edmonds/the-dude www.heraldnet.com/news/hows-the-water-ask-bill-lindsay/ Perhaps he should hire some young urchin to key enter the results ... and a second to proof. The city could erect a monument enshrining his results in stone (or other suitable medium). It might become known locally as "the wiggle". |
|
|
|
Post by missouriboy on Feb 12, 2018 14:27:30 GMT
Something Is Still Happening in the Heart of the Tropical Oceans(Paradigms may only be skin deep) ARGO data Anomaly From Monthly Mean Temperatures -Jan. 2004 to Oct. 2018 (last month available) TOP: 20S-20N Lat. 120E-360E Long. Pacific-Atlantic 100-300 meters depth - Long continued cooling since 2004. BOTTOM: 20S-20N Lat. 360E-120E Long. Indian 100-300 meters depth - dropping like a rock since 2016. 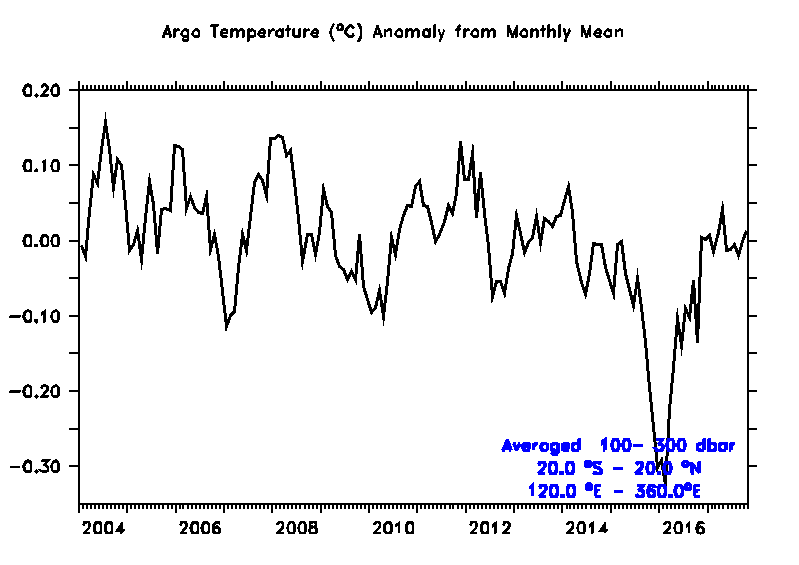 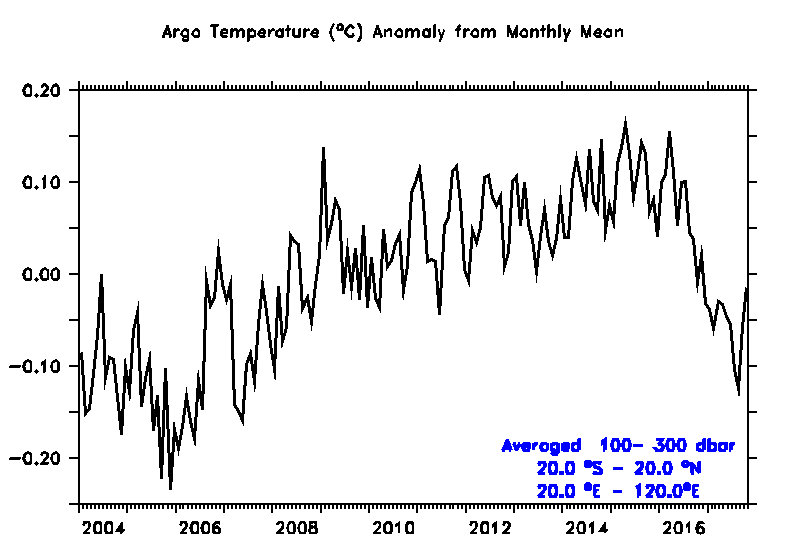
|
|
|
|
Post by missouriboy on Feb 12, 2018 15:58:44 GMT
ENSO As A Net Cooling Mechanism For the Tropical Pacific OceanThree ARGO graphs for Jan 2004 to Oct 2017 - 20S-20N Latitude 100-300 m depth Panel 1 shows the West Tropical Pacific and East Tropical Pacific Ocean West shows the Tropical Warm Pool with heat build up from 2004 to 2012. Eastward discharges fed the 2009 and 2015 El Ninos shown in the East section. Unlike 2010, when the West rapidly returned to its pre-Nino temperatures, 2016-17 has failed to do so. Panel 2 shows this has resulted in a net decrease in heat across the entire west-east section. 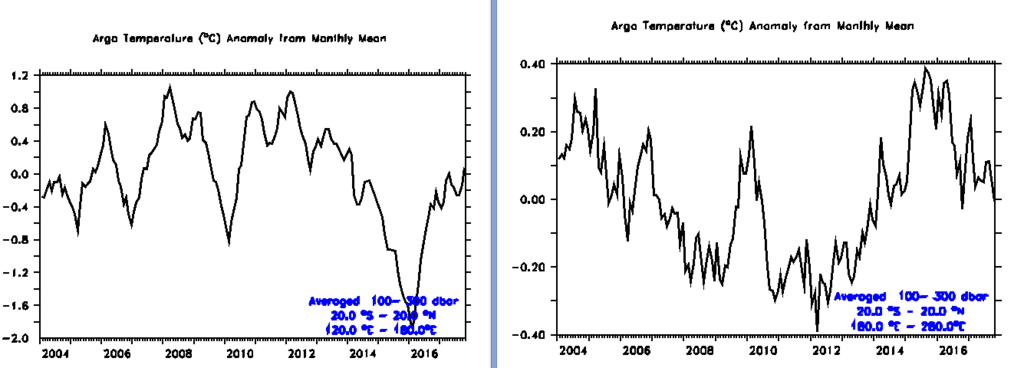 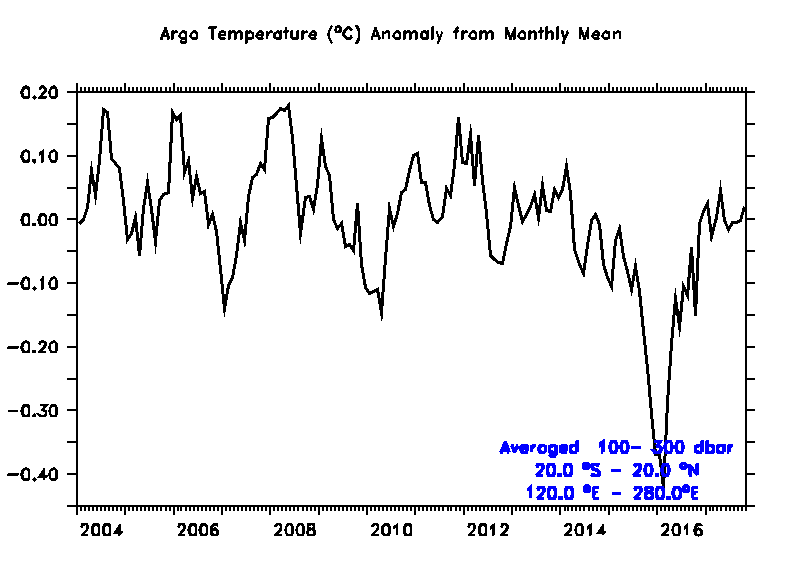
|
|


