|
|
Post by nonentropic on Aug 31, 2016 19:54:57 GMT
Sig the answer is to stop looking and assign a settled status to your worry points. Oh I forgot but do not forget to pickup $200 for going past go.
In all seriousness how do you measure cloud cover in a single location over time, its not like insolation or temperature then consider how you would aggregate that globally with some attribute metric to give it an impact factor for say solar radiation flux or temperature.
No wonder they just measured temperature.
|
|
|
|
Post by missouriboy on Aug 31, 2016 20:32:47 GMT
Sig the answer is to stop looking and assign a settled status to your worry points. Oh I forgot but do not forget to pickup $200 for going past go. In all seriousness how do you measure cloud cover in a single location over time, its not like insolation or temperature then consider how you would aggregate that globally with some attribute metric to give it an impact factor for say solar radiation flux or temperature. No wonder they just measured temperature. All the cloud cover data I've seen are from satellite data. Don't know why the project was stopped in 2010. They really do appear to be quite good. Perhaps that was the problem. Cloud cover to surface temperature relationships were calculated at R2 of 0.31. It is even higher for water surface temps at about 0.35 (based on ARGO data). |
|
|
|
Post by Ratty on Aug 31, 2016 23:11:55 GMT
At least Svensmark is looking outside of the box. Have to give him credit for that. Does his cosmic ray theory hold water? I am not sure it does or doesn't. There could very well be another source of cloud seeding that combines with cosmic rays that hasn't been investigated, or found yet. The more I learn, I realize the little I know. It's a shame some credentialed climate researchers didn't display a little humility too ......... |
|
|
|
Post by sigurdur on Sept 1, 2016 0:53:56 GMT
Sig the answer is to stop looking and assign a settled status to your worry points. Oh I forgot but do not forget to pickup $200 for going past go. In all seriousness how do you measure cloud cover in a single location over time, its not like insolation or temperature then consider how you would aggregate that globally with some attribute metric to give it an impact factor for say solar radiation flux or temperature. No wonder they just measured temperature. All the cloud cover data I've seen are from satellite data. Don't know why the project was stopped in 2010. They really do appear to be quite good. Perhaps that was the problem. Cloud cover to surface temperature relationships were calculated at R2 of 0.31. It is even higher for water surface temps at about 0.35 (based on ARGO data). I haven't figured out why cloud cover measurement was stopped. I am betting that the Military has a precise idea and it hasn't stopped for them! The short time it was measured and PUBLISHED, it wasn't helping the AGW narrative. I am not a conspiracy person, but sometimes I do wonder! |
|
|
|
Post by missouriboy on Sept 1, 2016 3:51:12 GMT
All the cloud cover data I've seen are from satellite data. Don't know why the project was stopped in 2010. They really do appear to be quite good. Perhaps that was the problem. Cloud cover to surface temperature relationships were calculated at R2 of 0.31. It is even higher for water surface temps at about 0.35 (based on ARGO data). I haven't figured out why cloud cover measurement was stopped. I am betting that the Military has a precise idea and it hasn't stopped for them! The short time it was measured and PUBLISHED, it wasn't helping the AGW narrative. I am not a conspiracy person, but sometimes I do wonder! I was looking at the web site again isccp.giss.nasa.gov/products and I'm not sure that they have stopped collecting it. It may be that they are simply not tabulating the monthly totals by geographic area. I would have to explore that in greater detail. However, not tabulating the data essentially does the same thing as I don't really have the capacity to take their large, high-density grids and weed them down to the monthly data I was using for very select geographic areas. The satellites have not stopped gathering data. The question is ... what data are still available for dates past 2009. I may be an available labor issue ... or it may be that they simply want to limit the distribution to small processors like me. I took a look at using HADSST3 data for comparison to the cloud data for years prior to ARGO but. as you can see from the chart below, HADSST3 (tallied from 5 x 5 degree grids for the same area) does not have anywhere near the resolution and time precision as ARGO. Too bad ... as there is nothing to compare the 1983 to 2003 cloud data to. 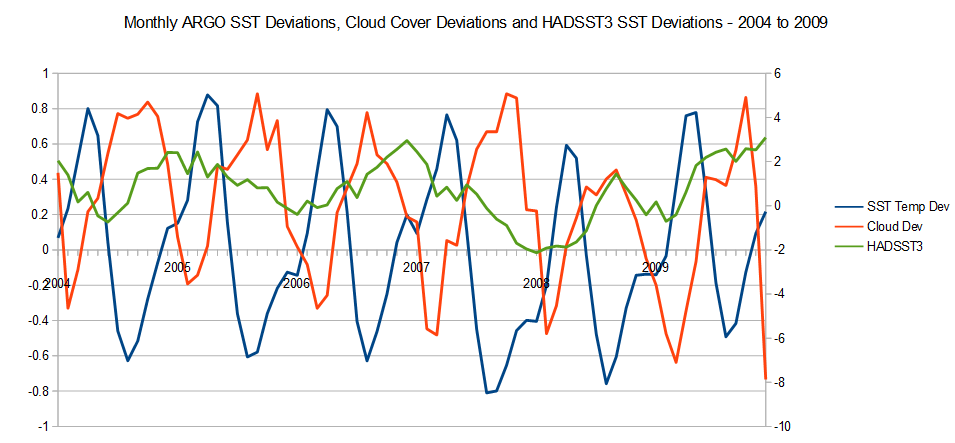 |
|
|
|
Post by douglavers on Sept 1, 2016 4:38:07 GMT
Svensmark now has a great deal of lab experimental work, some of it at CERN, to support his idea that muons are exceedingly efficient at seeding cloud formation.
Also the observations on Forbush events are supportive.
My own view is that he will eventually receive a Nobel when[?] the world finally concludes he was right.
I hope his case will not resemble Wegener: the latter did not get awarded because he was dead before the geophysics community realised he was right. They spent 40 years or so ridiculing him.
BTW IceAge Now dug up a sad little case of academic unfreedom: three professors apparently said that anyone who questionned the IPCC version of AGW was not welcome on their courses.
So much for the spirit of enquiry at university.
|
|
|
|
Post by Ratty on Sept 1, 2016 9:57:19 GMT
[ Snip ] BTW IceAge Now dug up a sad little case of academic unfreedom: three professors apparently said that anyone who questionned the IPCC version of AGW was not welcome on their courses. So much for the spirit of enquiry at university. I hope that's wrong but fear it's right. |
|
|
|
Post by missouriboy on Sept 2, 2016 5:36:18 GMT
English Winters and Solar CyclesAll of the record cold English winters, according to the CET records, have occurred during weak solar cycles. Many of them have occurred in the steep transition from a stronger solar cycle to a weaker one. The granddaddy of cold winters (-5 C deviation) occurred in 1684 in the middle of the Maunder Minimum. The winters of 1795 and 1814 (see chart on page 2 of this thread) occurred near solar minimum. The winter of 1814 occurred before the Tambora eruption (1815), which was followed by several cold winters ... none of which were as cold as 1814. The winter of 1879 was at the very beginning of the solar downturn of the 1880s, which produced another cold winter in 1895. The Krakatoa eruption occurred in 1883 and there were several cold winters following it ... none of which were as cold as 1879 or 1895. The winter of 1963, which appears to be about tied for the second coldest on record, occurred on the descent into the solar minimum of the 1960s. In comparison, the winter of 2010 doesn't stack up as much of a winter, but it too occurred just after the low point between SC23 and 24. Ya just gotta believe that, given the strength of this downturn, there is another record winter gonna hit in the next 3-4 years. Or maybe several cold ones surrounding one for the photo album. Sorry, but we're likely to get it too. I sure hope that extra heat in the oceans helps out. 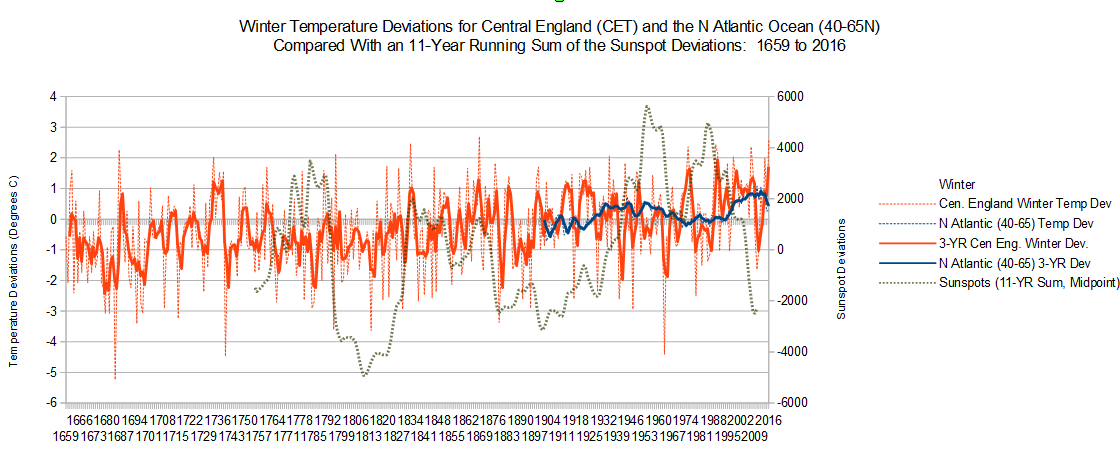 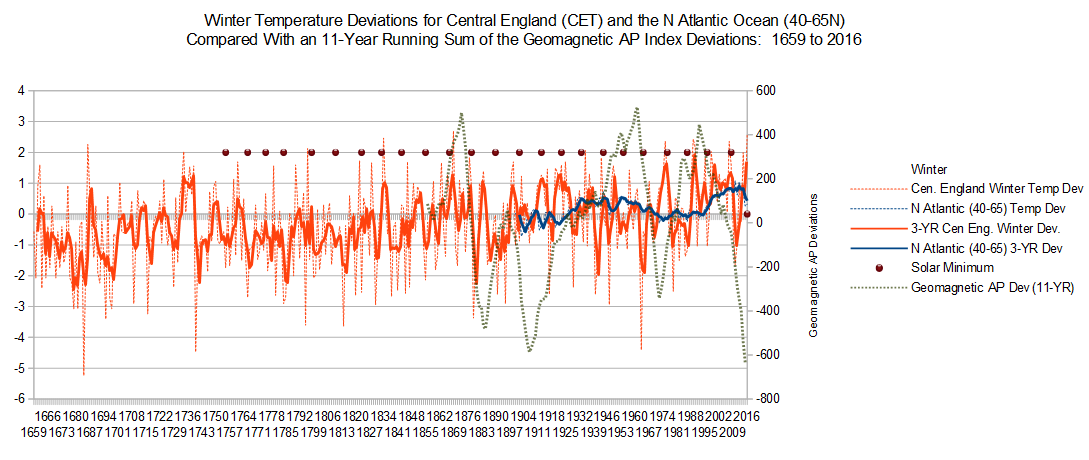 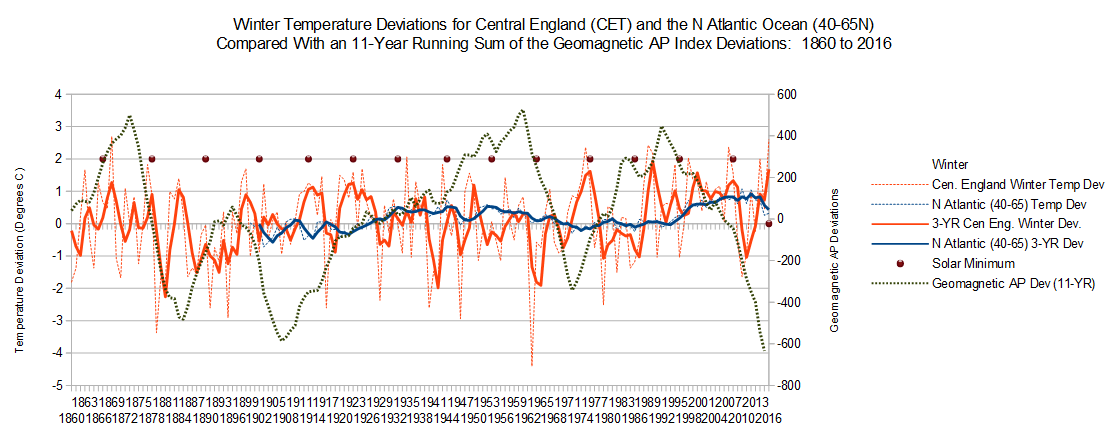
|
|
|
|
Post by acidohm on Sept 2, 2016 5:47:11 GMT
That's a great summary Missouriboy, thx for the UK specific info.
It is concerning that things may get a bit horrendous in the next few years.
|
|
|
|
Post by missouriboy on Sept 2, 2016 5:56:32 GMT
That's a great summary Missouriboy, thx for the UK specific info. It is concerning that things may get a bit horrendous in the next few years. Stock up on jammy liners and tickets to Cancun.  |
|
|
|
Post by duwayne on Sept 2, 2016 13:33:06 GMT
Missouriboy, the anaylses I have seen don't show much effect on global temperatures from solar cycles. But for long term studies, the CET's may be more accurate than the questionable global temperatures. I'd be interested in seeing if your visual observations can be represented in numbers. Have you tried to quantify the solar cycle effect on CET's? There are many sophisticated techniques for doing this, but I'd be interested even in a very simple one like what is the average of the CET 3-yr average anomalies at each solar minimum over the life of the temperature record and the same for solar maximum.
|
|
|
|
Post by icefisher on Sept 2, 2016 17:01:17 GMT
Missouriboy, the anaylses I have seen don't show much effect on global temperatures from solar cycles. But for long term studies, the CET's may be more accurate than the questionable global temperatures. I'd be interested in seeing if your visual observations can be represented in numbers. Have you tried to quantify the solar cycle effect on CET's? There are many sophisticated techniques for doing this, but I'd be interested even in a very simple one like what is the average of the CET 3-yr average anomalies at each solar minimum over the life of the temperature record and the same for solar maximum. Actually NOAA has one that was the favored theory prior to AGW cash cow being calved. Its probably still up on NOAAs website unlinked. Probably can find via google. The only problem with the analysis was it required multi-decadal smoothing which makes it largely useless for the most recent 3 or 4 decades. Like how NOAA defines solar maximums, they wait for a few years after the suspected zenith. I assume you mean long term analysis of grand solar cycles, if they exist. Short term cycles my analysis shows a strong correlation, using UK Met Hadcrut 3 and a smoothing algorithm. Smoothing algorithms are necessary for climate because we measure atmosphere temperature which is the tail of the dog when it comes to heat capacity for the planet and because the definition of climate is longterm weather. 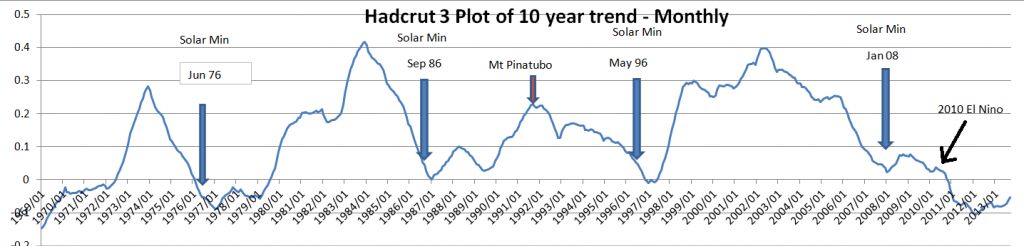 |
|
anse
Level 2 Rank

Posts: 62
|
Post by anse on Sept 2, 2016 21:18:07 GMT
Here’s one way of arriving at my estimate of a less than 0.2C cooling effect from Cycle 24/25. Please note that I am looking at climate effects of 20 years or more, not shorter ENSO-type effects or even shorter 1 year effects. Here’s the plot of historical average annual sunspot Groups from Svalgaard, et al. 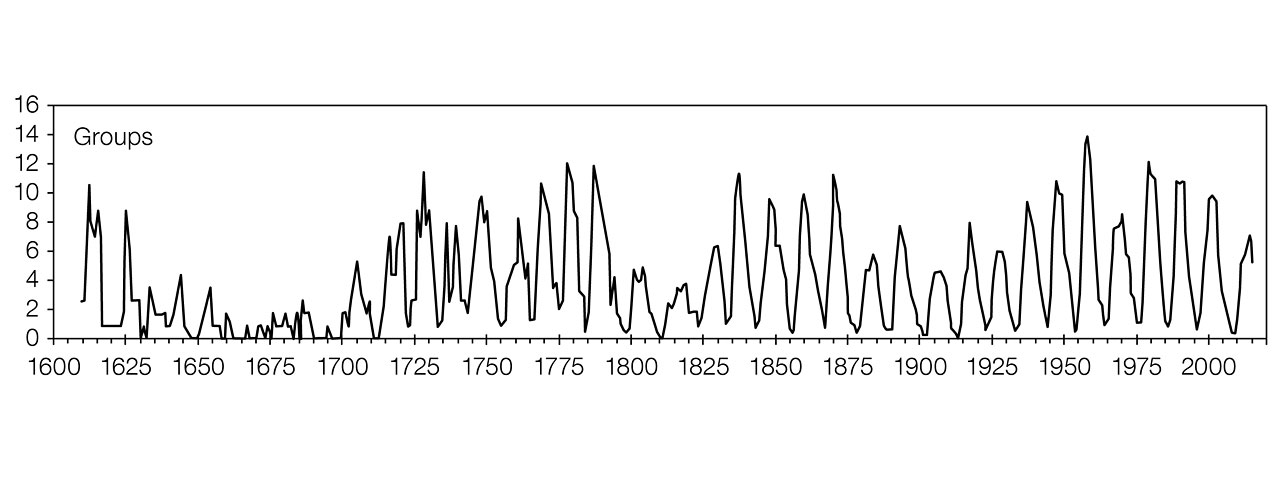 By looking at the chart above, one can see that the Cycle 24/Cycle 25 sunspot activity if Cycle 25 is similar to Cycle 24 as Svalgaard predicts would mean that the solar activity over these 2 cycles would be about twice as high it was during the Dalton Minimum in the 1800-1825 period. How much cooling was there in 1800-1825? The global temperature numbers from that period are not known, but there is a good record of the Central England Temperatures and the temperatures do show similar warming to the Hadcrut global temperatures during the period they are available from 1850 –about 0.8C. Here is the Central England Temperature (CET) record.  The temperature record clearly shows some cooling in the 1800-1825 Dalton Minimum period. But there are 3 similar cool periods in in the years before and after the Dalton Minimum period - the 1780’s, around 1840 and 1880’s. I’d encourage you to make your own guess as to how much of the cooling during the 25 or so years of the Dalton Minimum was actually caused by the less active sun. And then, if you believe Svalgaard's prediction, the Cycle 24/25 solar activity will likely be about twice that of the Dalton Minimum meaning there perhaps would be only half the Dalton Minimum cooling. But before you do that here is another factor worth noting. What was possibly the largest volcanic eruption in the last 2000 years occurred during the Dalton Minimum. Mt Tambora erupted and hurled some 10 cubic miles of material into the atmosphere in 1815, and 1816 was known as the “Year without a summer”. en.wikipedia.org/wiki/1815_eruption_of_Mount_TamboraThere's little doubt that the coolest years during the Dalton Minimum were largely due to the Tambora eruption. My guess is that the Dalton Minimum had less than a 0.4C global cooling effect versus the average temperatures of the time averaged over 20 years and based on that, Cycle24/25 should have less than half that effect or less than 0.2C. Duwayne, did you consider that the mean global temperature was about a degree Celcius lower prior to the Dalton minimum than it is today ? A climate shift into global cooling would probably give a "better" response today, considering we have the modern maximum behind us. During the Dalton minimum, Earth was still stuck in the LIA. If the theory with long term cloud increasement during low solar activity persists, I believe we will see global temperatures being offsetted downwards in conjunction with each La Niña, or perhaps even during El Niños. Since the seas hold a lot of energy, one need major events for global temperature to drop rapidly. If this is true, I have however not a clue how much the mean global temperature will fall. |
|
|
|
Post by duwayne on Sept 3, 2016 16:27:41 GMT
Anse said…..
“Duwayne, did you consider that the mean global temperature was about a degree Celcius lower prior to the Dalton minimum than it is today? A climate shift into global cooling would probably give a "better" response today, considering we have the modern maximum behind us. During the Dalton minimum, Earth was still stuck in the LIA.
If the theory with long term cloud increasement during low solar activity persists, I believe we will see global temperatures being offsetted downwards in conjunction with each La Niña, or perhaps even during El Niños. Since the seas hold a lot of energy, one need major events for global temperature to drop rapidly. If this is true, I have however not a clue how much the mean global temperature will fall.”
Yes, I did consider this. But I,like most others who are skeptical of catastrophic anthropogenic global warming, believe there is a greenhouse gas effect and I believe that much of the 1 degree global temperature rise from years prior to the Dalton minimum to the present is due to greenhouse gases. If the solar activity falls, the increased temperatures from the greenhouse gas effect will still be there.
Anse, what is your specific prediction as to average global temperatures during the course of cycles 24/25 if cycle 25 is similar to cycle 24 and how will that compare to the prior temperatures?
|
|
|
|
Post by missouriboy on Sept 3, 2016 18:12:03 GMT
Missouriboy, the anaylses I have seen don't show much effect on global temperatures from solar cycles. But for long term studies, the CET's may be more accurate than the questionable global temperatures. I'd be interested in seeing if your visual observations can be represented in numbers. Have you tried to quantify the solar cycle effect on CET's? There are many sophisticated techniques for doing this, but I'd be interested even in a very simple one like what is the average of the CET 3-yr average anomalies at each solar minimum over the life of the temperature record and the same for solar maximum. OK Duwayne. This may be a partial answer to your question. First, it is very hard to relate high-variance, short-term data such as summer, winter or annual temperatures to solar data. Large annual variances in, for example, winter temperatures, where one or two winters may be very cold but are followed by winters that are very warm. Averaging may be used but often washes out that which you're attempting to look at. In an attempt to get around that, I took the CET monthly temperature record and calculate the 25th, 50th and 75th percentile values across all winter months. Then I summed the number of winter months that were below these thresholds in each year and them summed these values across an 11-year running average. This allowed me to focus in on the coldest months in the record and plot them against 11-year running sums of geomagnetic and solar flux information. I used solar flux as it is available for most of the 1659-2016 CET record. Now our data take on a famiiar shape. Solar flux increased out of the Maunder Minimum, then declined in the Dalton, rose again into the early 1800s, declined into the 1880s, then progressed into our just past grand solar maximum, and is now declining. Over this same period the 11-year number of winter months whose mean temperatures were below the 50th percentile (chart 1) and the 75th percentile (chart 2) declined in a nearly reverse mirror image. The below-50 chart shows increases in cold winter months in the Maunder, the Dalton, and the 1880s. Here ... as flux declines cold winter months increase dramatically. There are places in the series however ... the transition zones ... where the slope of the two lines trend in the same direction. The early years are better differentiated in the less-than-50 chart. The later years show up better in the less-than-75 chart. Note that the 1960s shows up well in the 2nd chart but not in the first. There is no apparent doubt that our winters have warmed. I'll leave it to you to decide if this makes a better case for solar energy as a major cause. Note chart 3. I took the less-than-75 data and regressed number of cold months against solar flux. Vuella! Pretty tight fit. R2 suggests that 53% of the variance may be explained by changes in solar flux. 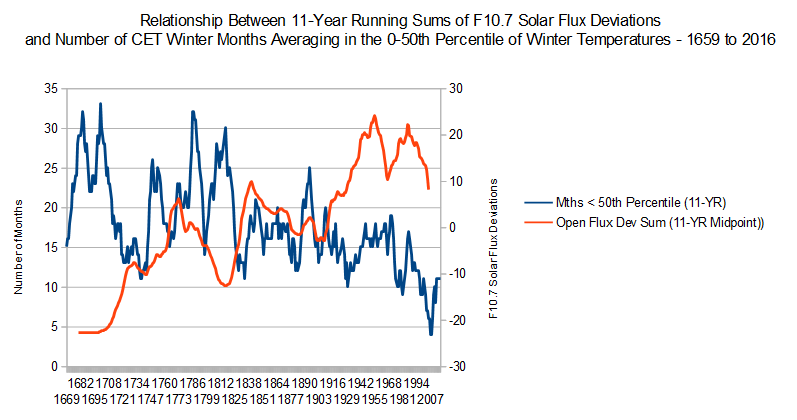 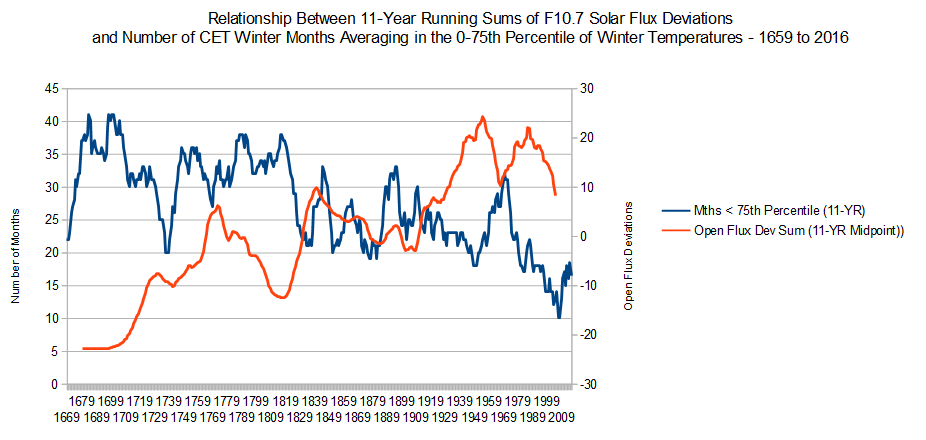 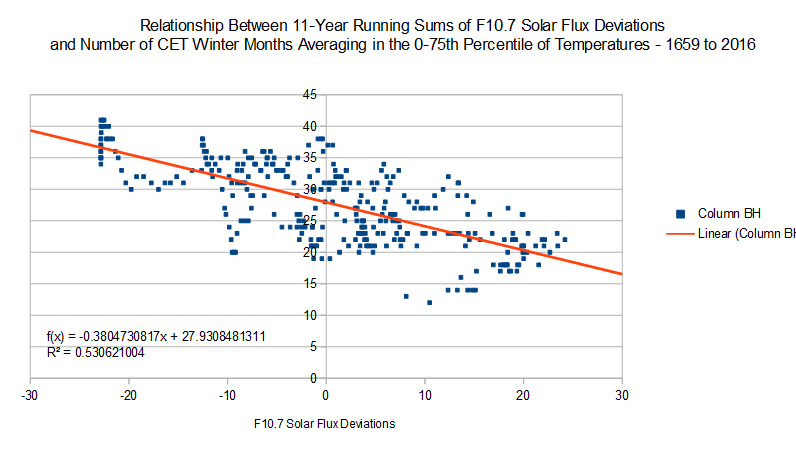 |
|


