|
|
Post by nonentropic on Sept 3, 2016 19:50:59 GMT
there is a relationship, the question is, is your method valid. It needs some thinking but regardless you do rinse out the essence of the CET record.
Are there other temperature records that have sufficient continuity to test this?
My instinct is that England is a country that exists only due to the tenuous flux of the sea current sourced in the Gulf of Mexico. if it were to stop it would resemble Sakhalin Island, somehow we have an amplified response to the solar cycle.
MB very clever stuff you should submit this stuff to WUWT and some of its authors.
It brings a quote to mind that asks the question of what are signs of intelligence and the answer was seeing similarities in things that are very different, and differences in things that very similar. Your work ticks both boxes.
|
|
anse
Level 2 Rank

Posts: 62
|
Post by anse on Sept 4, 2016 21:06:19 GMT
Anse said….. “Duwayne, did you consider that the mean global temperature was about a degree Celcius lower prior to the Dalton minimum than it is today? A climate shift into global cooling would probably give a "better" response today, considering we have the modern maximum behind us. During the Dalton minimum, Earth was still stuck in the LIA. If the theory with long term cloud increasement during low solar activity persists, I believe we will see global temperatures being offsetted downwards in conjunction with each La Niña, or perhaps even during El Niños. Since the seas hold a lot of energy, one need major events for global temperature to drop rapidly. If this is true, I have however not a clue how much the mean global temperature will fall.” Yes, I did consider this. But I,like most others who are skeptical of catastrophic anthropogenic global warming believe there is a greenhouse gas effect and I believe that much of the 1 degree global temperature rise from years prior to the Dalton minimum to the present is due to greenhouse gases. If the solar activity falls, the increased temperatures from the greenhouse gas effect will still be there. Anse, what is your specific prediction as to average global temperatures during the course of cycles 24/25 if cycle 25 is similar to cycle 24 and how will that compare to the prior temperatures? Duwayne, my (gu)estimation is that the next major la Nina will offset back global temperatuers to levels pre-1998. After the second one I believe temperatures will be constantly back on the negative side, not seen since the late 80s. www.drroyspencer.com/wp-content/uploads/UAH_LT_1979_thru_August_2016_v6.jpg |
|
|
|
Post by duwayne on Sept 5, 2016 14:57:17 GMT
Missouriboy, that's a good analysis which obviously took some time and it does indicate there is an effect on global temperature from changing solar activity over the long term. My question was, and is, can this effect be quantified and is it a large effect? Sunspot counts are often used as the measurement of solar activity. Since F10.7 flux readings began in the 1940's I presume the F10.7 readings you use for years prior to that time are derived from sunspot data. So, if we believe sunspots are a good indicator of solar activity, then we have the opportunity to view the effects of very low activity (zero sunspots) and high activity (11-year cycle maximums) on a regular basis over many decades. My earlier question with respect to quantifying the effect of solar activity was referring to the global temperature effect observed over the many individual observed solar cycles and whether your earlier analysis could be used for this quantification by comparing the global temperatures at tops and bottoms of the solar cycles using Central England Temperatures. When I first began to look into global warming I ran a Fourier analysis looking for an 11-year cycle effect on global temperatures. I couldn't find a significant effect although I recognize that Solar Cycles vary some in length and that may hide some of the effect. 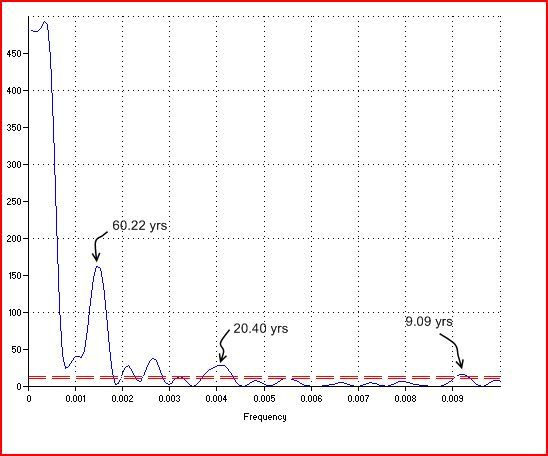 The chart above is based on the Hadcrut3 global temperature record. I have seen other studies including one a few months ago by Will Eschenbach on WUWT which show no or very small 11-year cycles in global temperatures. I am ready to buy into a significant Solar activity effect if I can see a quantification of the effect and an explanation of why it doesn't show up in the 11-year cycle. Until then I have to go with a very small effect unless we experience a Maunder Minimum which I believe might have a significant lasting impact for reasons I described a few weeks ago. |
|
|
|
Post by nautonnier on Sept 5, 2016 16:17:38 GMT
Just a thought.
Everyone seems to be looking for a single control knob that therefore must have a signal for its off and on variation. But what if there are several control knobs, none of which have a real effect on their own but only if the others are in a particular set of values in relation to others - in other words a chaotic system of systems. Taking one of these interrelated control knobs will not show any direct effect. It seems though that instead of looking for these multiple interrelationships people have split into camps insisting that their particular control knob is THE control knob and the others have no real effect.
This malaise seems to have affected the entire climate 'science' pro-warming and the 'denier' camps.
But things are demonstrably not hat simple.
|
|
|
|
Post by icefisher on Sept 5, 2016 18:16:02 GMT
|
|
|
|
Post by missouriboy on Sept 5, 2016 19:38:18 GMT
I have to agree with Nautonnier. There are multiple knobs and we are just barely literate in what they are and how they function and interact. I readily admit what I like to think of as a logical bias towards the sun, although I am perfectly willing to give it up if it can be falsified. The sun and other 'space' effects, as mentioned by Astro, are in my view the likely primary drivers. We have some reasonably good solar measures, but are also likely missing some or many. There are other possible drivers such as geothermal on which we are truely ignorant. In terms of effects, we seem limited to two classes of data: long-term proxy data from which geological era climate estimates have been made, and shorter-term 'weather' data sets compiled from fixed and mobile recording stations (including satellites). These are generally, of various quality and limited in terms of spatial extent. Then of course, we have reconstructed data sets. In between we have an atmosphere together with pressure patterns and movements which affect how the inputs effect the surface weather. At any station, the variances in the measurements are almost always greater than what might be considered a 'climate' vector. Sometimes the message (or parts of it) is in 'the noise', thus averaging may not tell you anything. But we endeavor to persevere. I'm of the opinion that long-term climate trends should be best observed in the oceans as this liquid medium generally suppresses large variances. The fact that the CET is surrounded by ocean should make the land records (the longest we have) more relevant to measuring climate change. But even here, changes in atmospheric circulation can impart large variances to the record. These are easily observed in the graphs that I posted on the 2nd page of this thread. However, the temporal land records trend very closely to the HADSST3 trends for the N Atlantic Ocean. Assuming that the relationship between the CET record and the HADSST3 record over the last 116 years remained similar for earlier time periods, then we might reasonably state that the N Atlantic Ocean temperature for similar CET temperature time periods (1840-75 and 1700-1720) may have been very similar to those temperatures observed between 1900 and 1920, which is about 0.7 to 0.8 C below the last 3-year average point on this chart. A similar back-of-the-envelope guesstimate for N Atlantic SSTs in the depths of the 1880s downturn could have been another 0.7 to 0.8 C below 1900-1920. Since I have not extracted the N Atlantic HADSST3 data for 1850 to 1900 yet, I can test that guesstimate ... with the understanding that reconstructed data such as HADSST3 probably become less reliable at distance from the present.
As for extrapolating to World temperature trends, I have some faith in the satellite data. Regrettably, I have a LOT less faith in other sources. 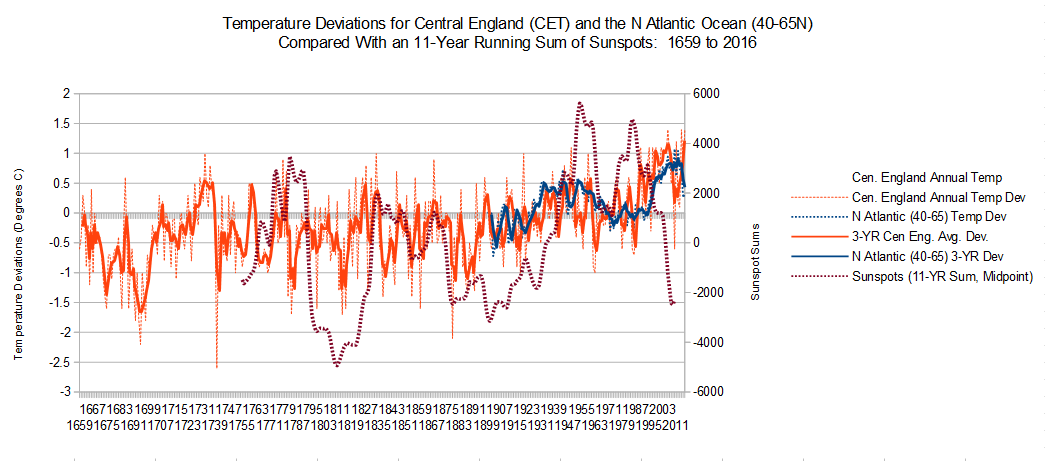 |
|
|
|
Post by nonentropic on Sept 5, 2016 22:12:24 GMT
All the successful religions end up with one god so it was inevitable I suppose.
In reality they are claiming not one knob but one very big knob which in spinville is one knob.
Most papers from any perspective are talking about various inputs into the field of climate but have to have the disclaimer sentence, but this effect will be overwhelmed by CO2 induced CAGW.
Popes from Galilean times would be proud.
|
|
|
|
Post by missouriboy on Sept 6, 2016 2:34:47 GMT
All the successful religions end up with one god so it was inevitable I suppose. In reality they are claiming not one knob but one very big knob which in spinville is one knob. Most papers from any perspective are talking about various inputs into the field of climate but have to have the disclaimer sentence, but this effect will be overwhelmed by CO2 induced CAGW. Popes from Galilean times would be proud. The Great Knob is like the Kaaba Stone. Millions bow to it from around the World. Saint Michael de Mann and the Duke of Gore craft praises to its name and vie for photo ops. Delphi had nothing on the Knob. Its pronouncements bring the faithful to their knees and humble the proud. The souvenir business is good.  |
|
|
|
Post by missouriboy on Sept 6, 2016 3:04:30 GMT
Missouriboy, that's a good analysis which obviously took some time and it does indicate there is an effect on global temperature from changing solar activity over the long term. My question was, and is, can this effect be quantified and is it a large effect? Sunspot counts are often used as the measurement of solar activity. Since F10.7 flux readings began in the 1940's I presume the F10.7 readings you use for years prior to that time are derived from sunspot data. So, if we believe sunspots are a good indicator of solar activity, then we have the opportunity to view the effects of very low activity (zero sunspots) and high activity (11-year cycle maximums) on a regular basis over many decades. My earlier question with respect to quantifying the effect of solar activity was referring to the global temperature effect observed over the many individual observed solar cycles and whether your earlier analysis could be used for this quantification by comparing the global temperatures at tops and bottoms of the solar cycles using Central England Temperatures. Duwayne. Here are some comparisons of solar index values to temperature records from 1890 to 2016 for Central England and the Upper North American Grain Belt. Climatically, these are two very different areas ... the first is a high-latitude (51.5 N) marine climate whose climate is heavily influenced by the N Atlantic Ocean ... the second is a set of recording stations (44 to 50 N) located in the center of the N American continent with no direct marine influence. The Upper North American Grain BeltThis chart seems to show a coincidence between highs and lows in the annual geomagnetic AP index and temperature highs and lows for winter months at recording stations along longitude 96.5 in the N American Grain Belt between 44 and 50 North latitude. Interesting that it should occur at continental interior locations and in the winter. Perhaps it is because there is likely little lag effect (unlike the oceans) and geomagnetic activity may affect the southward movement of cold air masses in mid-N America. But all of that is just SWAG. Simple linear regressions yield no significant correlations, which is not surprising, even though there appears to be visual linkage of highs to highs and lows to lows. I have also included a summer series for comparison. 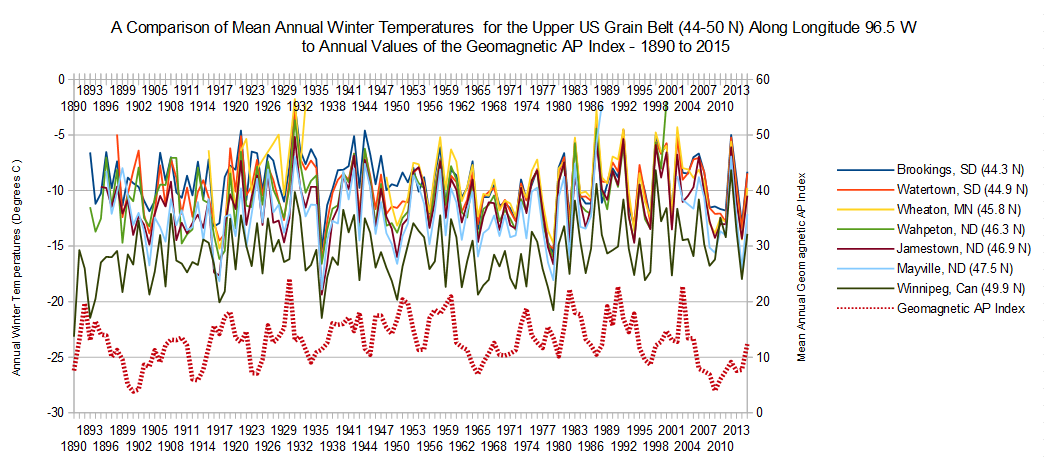 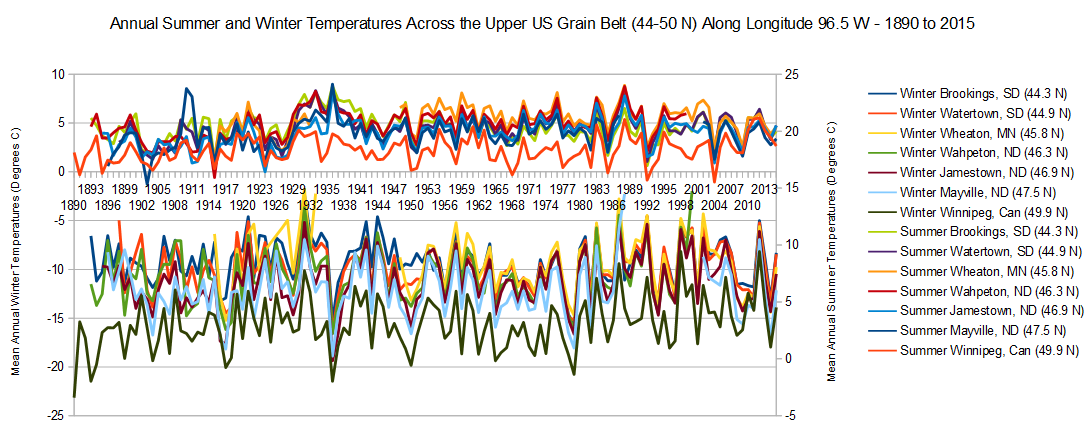 The Central England Temperature Record and the North Atlantic Ocean The Central England Temperature Record and the North Atlantic OceanLike the upper US Midwest, there is no simple relationship between CET records and solar indexes. Although a simple visual analysis notes some correspondence between highs and lows in each series, no simple statistics yield satisfactory relationships. English weather. in as much as I understand it, is dependent on the source of the air masses ... either oceanic (south westerly to westerly) or continental (north easterly to easterly). English winters show large variances year to year and seem to often run in multi-year sequences with one or two colder winters followed by warmer ones. Note that this chart's title is incorrect. CET temperatures are for the winter months while the N Atlantic temperatures are annual. The variance between winters appears to increase around periods of solar cycle changes. Note those that have been occurring since the last solar cycle minimum. These variances are, of course, no where near as great as in the American Midwest. Many of the colder winters seem to occur when the AP index drops dramatically (note 1962-63 and 2009-10). Previous charts posted on this site and other publications have noted the apparent relationship between ocean temperatures and solar cycles. North Atlantic temperature trends are similar to the rest of the Atlantic, but the deviations are greater. 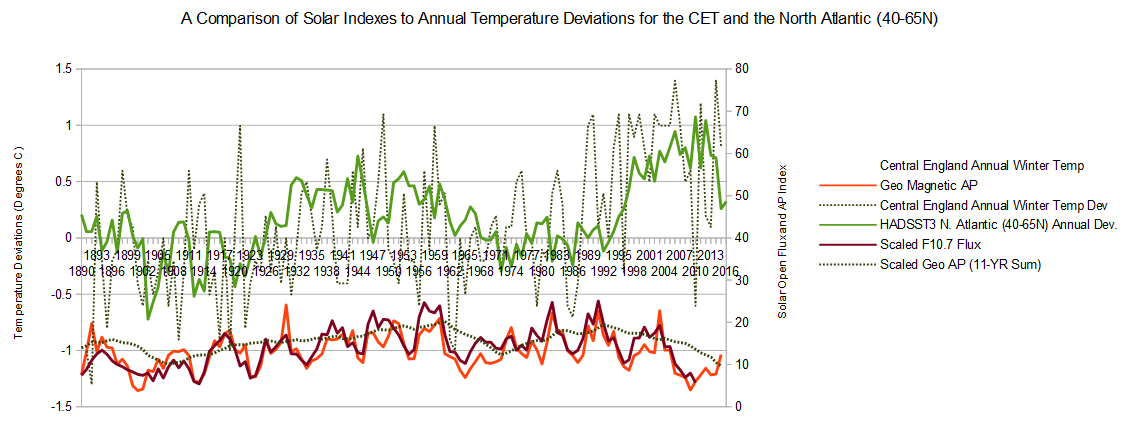 |
|
|
|
Post by walnut on Sept 10, 2016 17:10:16 GMT
It has been at least a little wetter and cooler in Oklahoma over the last several years. Deep green grass on August 30th 2 years in a row. Very pleasant, temperate climate (ok, weather, for several years in a row). Corn and wheat cash prices nothing unusual. AGW hardly seems worth much concern, at least from this data point.
|
|
|
|
Post by walnut on Sept 10, 2016 17:18:15 GMT
Mumbai and Miami are still 4' and 5.9' above sea level. Didn't see that one coming. Al Gore was measuring the expected sea level rise in feet, right?
|
|
|
|
Post by Ratty on Sept 10, 2016 22:45:41 GMT
It has been at least a little wetter and cooler in Oklahoma over the last several years. Deep green grass on August 30th 2 years in a row. Very pleasant, temperate climate (ok, weather, for several years in a row). Corn and wheat cash prices nothing unusual. AGW hardly seems worth much concern, at least from this data point. How about the Juglans Nigra price, Walnut? |
|
|
|
Post by walnut on Sept 10, 2016 22:59:08 GMT
It has been at least a little wetter and cooler in Oklahoma over the last several years. Deep green grass on August 30th 2 years in a row. Very pleasant, temperate climate (ok, weather, for several years in a row). Corn and wheat cash prices nothing unusual. AGW hardly seems worth much concern, at least from this data point. How about the Juglans Nigra price, Walnut? I am going to assume that you acknowledge that American black walnuts taste better than dreary English walnuts. Also the wood is prettier. I don't know what the price will be this year. The meat is so difficult to extract from their poorly designed, complicated shells that mass production of black walnuts is not so easy so the price stays quite high. I am not a farmer, I just have maybe 40 walnut trees and maybe 50 pecan trees. Enough for about $20 worth of nuts. I just like trees. I think I remember that Sig has a real black walnut operation though. |
|
|
|
Post by nautonnier on Sept 12, 2016 13:16:42 GMT
There Probably Won't Be A “Mini Ice Age” In 15 Yearswww.iflscience.com/environment/mini-ice-age-not-reason-ignore-global-warming/However, Zharkova ends with a word of warning: not about the cold but about humanity's attitude toward the environment during the minimum. We must not ignore the effects of global warming and assume that it isn't happening. “The Sun buys us time to stop these carbon emissions,” Zharkova says. The next minimum might give the Earth a chance to reduce adverse effects from global warming. People were wondering how she got published; now we know she has the required genuflection to AGW. |
|
|
|
Post by walnut on Sept 12, 2016 13:24:31 GMT
That comment invalidates her credibility. She is confusing natural climate change, which no one denies, with man made global warming, and assuming it is a fact.
I doubt she enjoyed her 15 minutes of fame, though. She was cast out of the church. She sounds almost as confused and feeble as Hillary.
|
|


