|
|
Post by nautonnier on Jan 19, 2019 11:09:35 GMT
Click on the run > Judging by the color key - that is 20C below normal in a large swathe of the US |
|
|
|
Post by Ratty on Jan 19, 2019 12:02:44 GMT
Click on the run > Judging by the color key - that is 20C below normal in a large swathe of the US Cold = weather. Hot = climate. How many times do I need to tell you?  |
|
|
|
Post by nautonnier on Jan 20, 2019 12:42:11 GMT
Some more weather for you Ratty... |
|
|
|
Post by nautonnier on Jan 20, 2019 14:04:00 GMT
"Meteorologist Joe Bastardi Warns Brutal Cold About To Grip Large Areas Of Northern Hemisphere As winter progresses through January and heads into February, the latest forecast tells us one thing: Global warming is not putting an end to brutal cold winter conditions like experts said it would in the early 2000s. At his Weatherbell Analytics Saturday Summary yesterday, meteorologist Joe Bastardi pretty much gave his seal of approval on the latest longer-term NCEP forecast for North America and Europe. Bastardi has long said that the current winter would turn out to be “severe”. It fits with the pattern we were thinking would evolve for this winter.” Well, the winter party is about to start in earnest. What follows is the NCEP CFS forecast temperature anomaly for North America for the next 45 days: 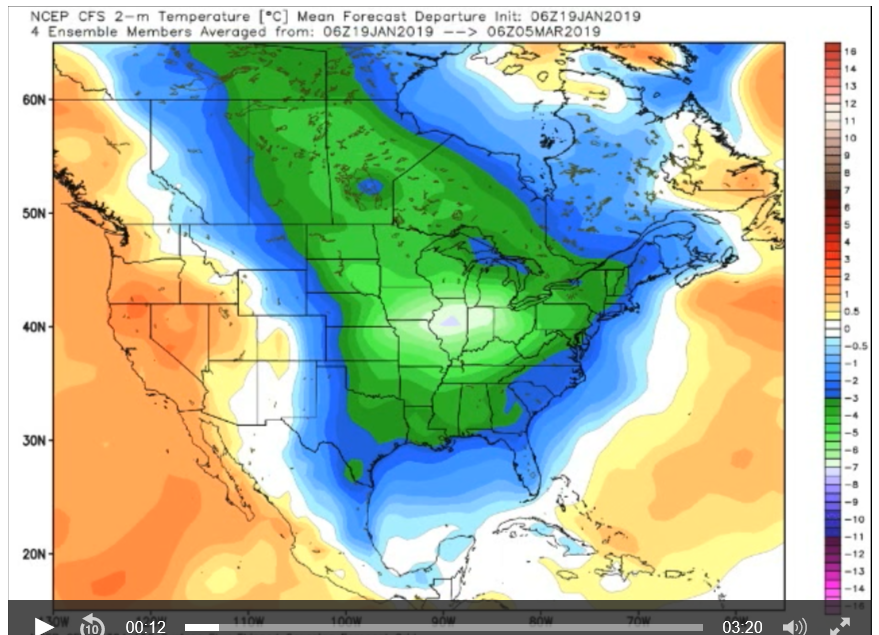 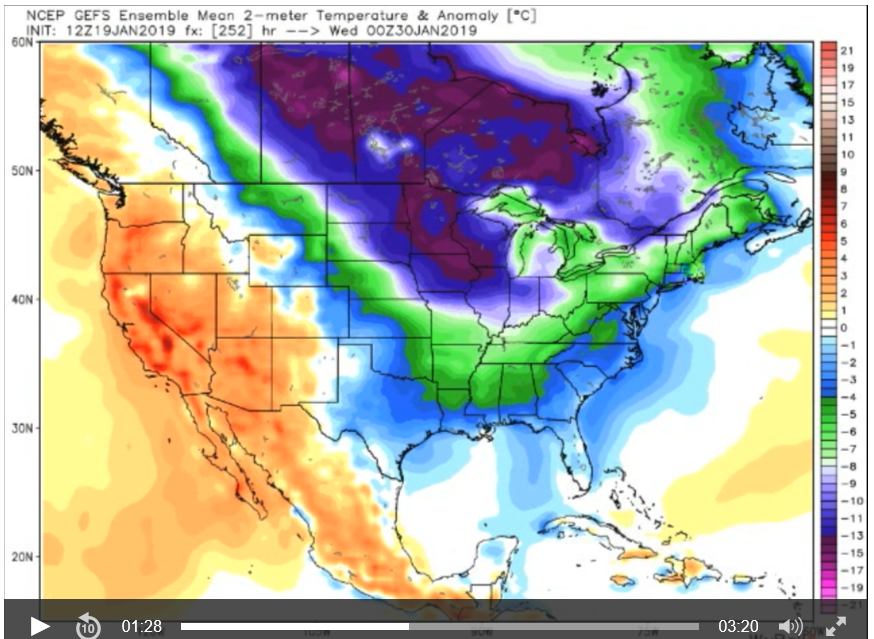 notrickszone.com/2019/01/20/meteorologist-joe-bastardi-warns-brutal-cold-about-to-grip-large-areas-of-northern-hemisphere/ notrickszone.com/2019/01/20/meteorologist-joe-bastardi-warns-brutal-cold-about-to-grip-large-areas-of-northern-hemisphere/Based on: www.weatherbell.com/video/the-saturday-summary-157 |
|
|
|
Post by nautonnier on Jan 20, 2019 14:20:21 GMT
|
|
|
|
Post by nautonnier on Jan 20, 2019 14:50:53 GMT
|
|
|
|
Post by acidohm on Jan 20, 2019 17:39:35 GMT
Only 2009 and 1987 have had longer lasting ssw in 40years of records
|
|
|
|
Post by acidohm on Jan 20, 2019 18:07:51 GMT
Ive been thinking about this event more and more as a 'long wave' event as opposed to the 2018 ssw which could be called 'short wave'.
Things are still currently developing so much remains to be seen. However, would it be possible to suppose the 'frequency' and amplitude of something like this could lead to a comparison to energy levels??
Its a very proto-thought, however, could the area measured within the graphed wave compare to atmospheric strength?
The relevance would be marked where a short sharp ssw would clearly then have a much lower value then a long strong one.
Also, 10% difference in amplitude would have a much reduced value in a high frequency event then 10% difference in a low frequency event.
This would perhaps have importance when forecasting the effects of events such as this one, i dont really think anyone has a real grasp of how to quantify what we're seeing...
Am i talking nonsense? 🤔
|
|
|
|
Post by sigurdur on Jan 20, 2019 18:14:13 GMT
Nope.
|
|
|
|
Post by nautonnier on Jan 20, 2019 18:27:20 GMT
Ive been thinking about this event more and more as a 'long wave' event as opposed to the 2018 ssw which could be called 'short wave'. Things are still currently developing so much remains to be seen. However, would it be possible to suppose the 'frequency' and amplitude of something like this could lead to a comparison to energy levels?? Its a very proto-thought, however, could the area measured within the graphed wave compare to atmospheric strength? The relevance would be marked where a short sharp ssw would clearly then have a much lower value then a long strong one. Also, 10% difference in amplitude would have a much reduced value in a high frequency event then 10% difference in a low frequency event. This would perhaps have importance when forecasting the effects of events such as this one, i dont really think anyone has a real grasp of how to quantify what we're seeing... Am i talking nonsense? 🤔 I remember reading a paper some time ago making similar points assessing the energy flows in weather systems. There is the kinetic and potential energy exchange of uplift, the kinetic energy of winds, then the heat exchange as latent heat is transported from the surface to height where it is released. The figures were huge. Yours is a similar concept. Yes - 10% of a large disturbance will have more energy content than 10% of small one. Also the energy exchange of a large area of cold needs to be considered. These are big numbers |
|
|
|
Post by acidohm on Jan 20, 2019 18:27:56 GMT
Any idea how id make it sound more science like Sig?? 🤔 Does it compare to existing laws of sone sort.... |
|
|
|
Post by missouriboy on Jan 20, 2019 18:31:30 GMT
Trying to "mine" your increasing knowledge of atmospheric flows Acid. How does this near record SSW in the stratosphere translate downward over time (now to March for example) into tropospheric cold results in N America and Europe? Stratospheric flow returns to westerly, while troposphere flow remains blocked? And invaded by cold arctic air masses through March? Does anyone have a reasonable idea of how (mechanics) this event translates downward and outward over a period of time? I know I'm asking for a lot. |
|
|
|
Post by acidohm on Jan 20, 2019 18:38:20 GMT
Ive been thinking about this event more and more as a 'long wave' event as opposed to the 2018 ssw which could be called 'short wave'. Things are still currently developing so much remains to be seen. However, would it be possible to suppose the 'frequency' and amplitude of something like this could lead to a comparison to energy levels?? Its a very proto-thought, however, could the area measured within the graphed wave compare to atmospheric strength? The relevance would be marked where a short sharp ssw would clearly then have a much lower value then a long strong one. Also, 10% difference in amplitude would have a much reduced value in a high frequency event then 10% difference in a low frequency event. This would perhaps have importance when forecasting the effects of events such as this one, i dont really think anyone has a real grasp of how to quantify what we're seeing... Am i talking nonsense? 🤔 I remember reading a paper some time ago making similar points assessing the energy flows in weather systems. There is the kinetic and potential energy exchange of uplift, the kinetic energy of winds, then the heat exchange as latent heat is transported from the surface to height where it is released. The figures were huge. Yours is a similar concept. Yes - 10% of a large disturbance will have more energy content than 10% of small one. Also the energy exchange of a large area of cold needs to be considered. These are big numbers I cant do numbers....they just party in my head and make too much noise.. I can do visualising of abstract things/concepts. In any case, giving an ssw a value doesnt garauntee effect at the surface as chaos and forcings push resulting cold effects at the whim of fluid dynamics. (Although perhaps the pattern of strat vortex distributions give a clue...) What it would do however is give a strength and duration clue which would be useful, especially uk, where cold effects may be outside of short range models. Blocking, given time, can establish after initial attempts fail and winter then bites once initial confidence is lost. Which is what i suspect is happening now. There is currently now way to explain the potential to an ssw, everyone, even paid forecasters, are shooting from the hip! |
|
|
|
Post by acidohm on Jan 20, 2019 18:47:42 GMT
Trying to "mine" your increasing knowledge of atmospheric flows Acid. How does this near record SSW in the stratosphere translate downward over time (now to March for example) into tropospheric cold results in N America and Europe? Stratospheric flow returns to westerly, while troposphere flow remains blocked? And invaded by cold arctic air masses through March? I keep hearing true ssw effects occur once zonal reversal transmits to the trop and zonal winds re-establish at strat. So yes, its taken a looong time to create negative zonal at surface and re-establish at strat, not quite there yet! I reckon 2 weeks will peak. We'll see, 2 weeks ago i proposed this was a long duration event, no-one else had. Its literally staggering how little grasp there is on these things....very badly understood. Someone out there must know more but ive yet to find them. Ssw probably causes 70-80% of significant cold events!!! |
|
|
|
Post by missouriboy on Jan 20, 2019 19:24:09 GMT
Trying to "mine" your increasing knowledge of atmospheric flows Acid. How does this near record SSW in the stratosphere translate downward over time (now to March for example) into tropospheric cold results in N America and Europe? Stratospheric flow returns to westerly, while troposphere flow remains blocked? And invaded by cold arctic air masses through March? I keep hearing true ssw effects occur once zonal reversal transmits to the trop and zonal winds re-establish at strat. So yes, its taken a looong time to create negative zonal at surface and re-establish at strat, not quite there yet! I reckon 2 weeks will peak. We'll see, 2 weeks ago i proposed this was a long duration event, no-one else had. Its literally staggering how little grasp there is on these things....very badly understood. Someone out there must know more but ive yet to find them. Ssw probably causes 70-80% of significant cold events!!! Many(?) of the others may be still trying to figure out how the settled science of CO2-driven climate causes all of this.  Here's your chance! There may be an atmospheric plumbing career with your name on it. Whoever coined the phrase " Piled higher and Deeper" knew what they were talking about. Sometimes what is required is someone to clean the clogs out of the pipeline of knowledge. Of course, sometimes they also get crucified. Dynamic formation of extreme ozone minimum events over the Tibetan Plateau during northern winters 1987–2001 agupubs.onlinelibrary.wiley.com/doi/pdf/10.1029/2009JD013130On the Linkage among Strong Stratospheric Mass Circulation, Stratospheric Sudden Warming, and Cold Weather Events journals.ametsoc.org/doi/abs/10.1175/MWR-D-18-0110.1cas.nuist.edu.cn/TeacherFiles/file/20180809/6366940784135030454056931.pdfThe Impact of a Changing Climate on the Frequency of Sudden Stratospheric Warming Events scholarworks.sjsu.edu/cgi/viewcontent.cgi?article=8344&context=etd_thesesStratosphere - Troposphere Interaction during Stratospheric Sudden Warming Events oceanrep.geomar.de/28744/1/834531058-MIT.pdfIdentification and Classification of Stratospheric Sudden Warming Events commons.erau.edu/cgi/viewcontent.cgi?article=1061&context=edtMany other pdfs from search at Duckduckgo.com list of strong stratospheric warming events |
|


 Here's your chance! There may be an atmospheric plumbing career with your name on it. Whoever coined the phrase "Piled higher and Deeper" knew what they were talking about. Sometimes what is required is someone to clean the clogs out of the pipeline of knowledge. Of course, sometimes they also get crucified.